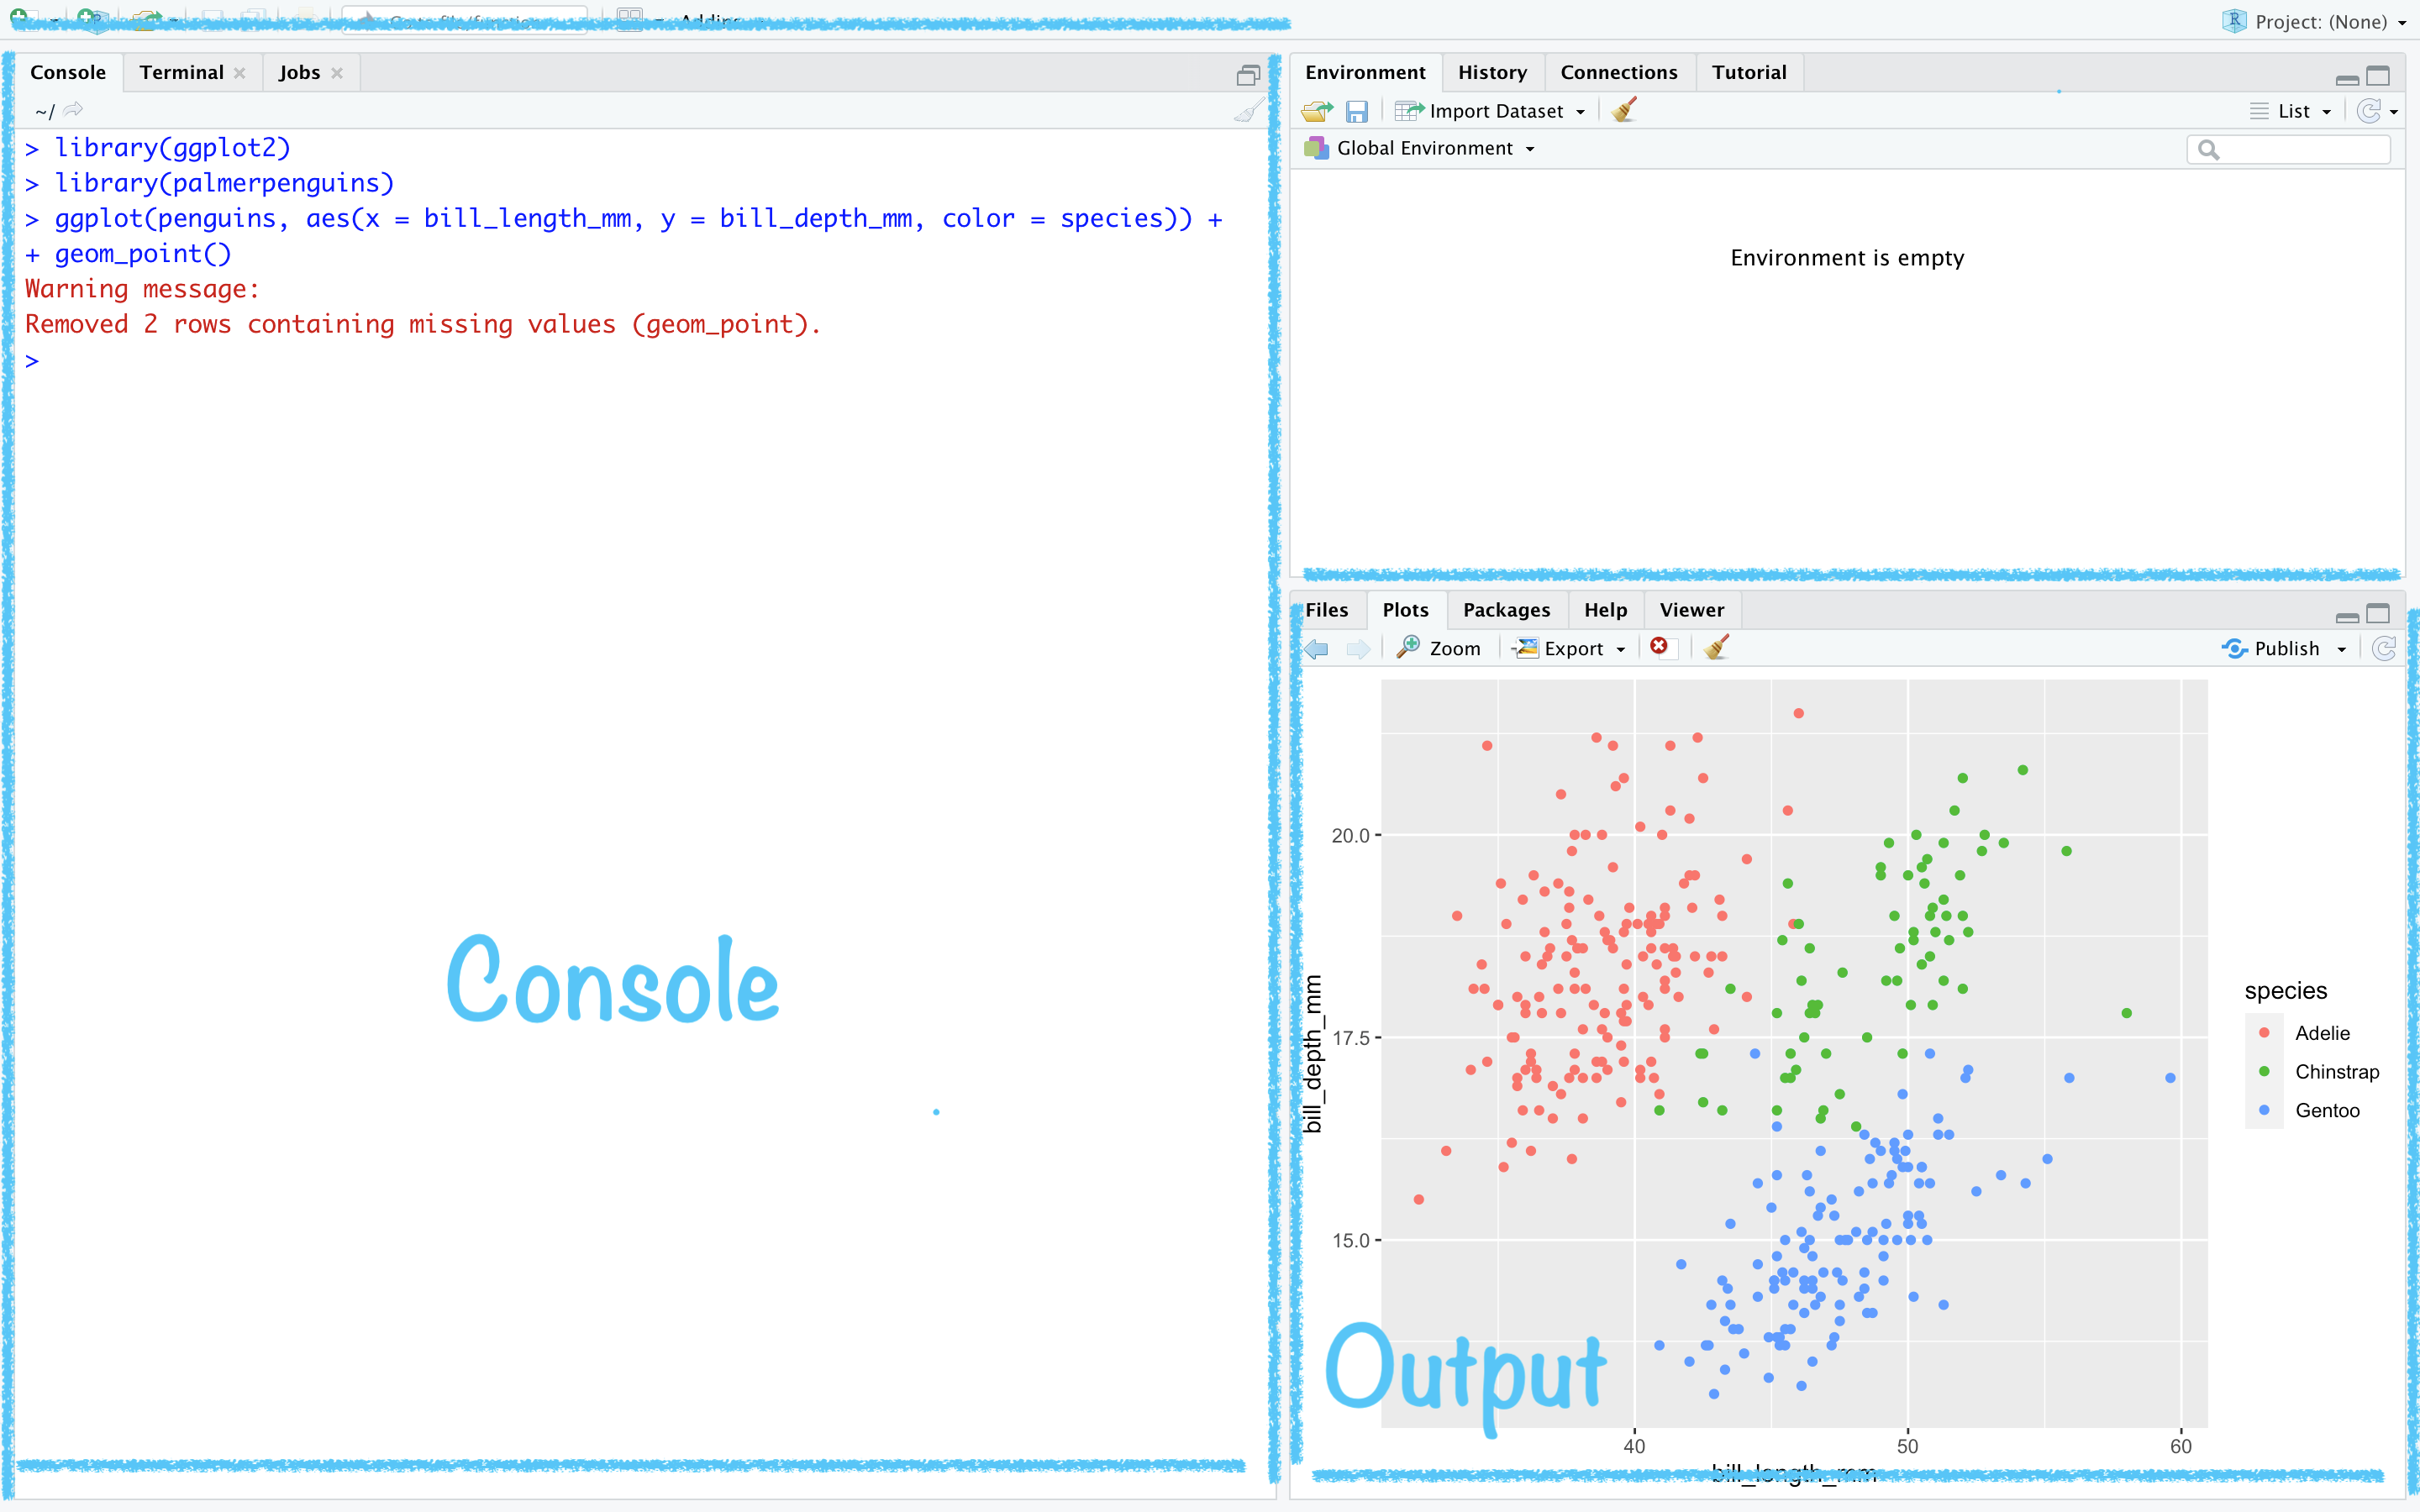
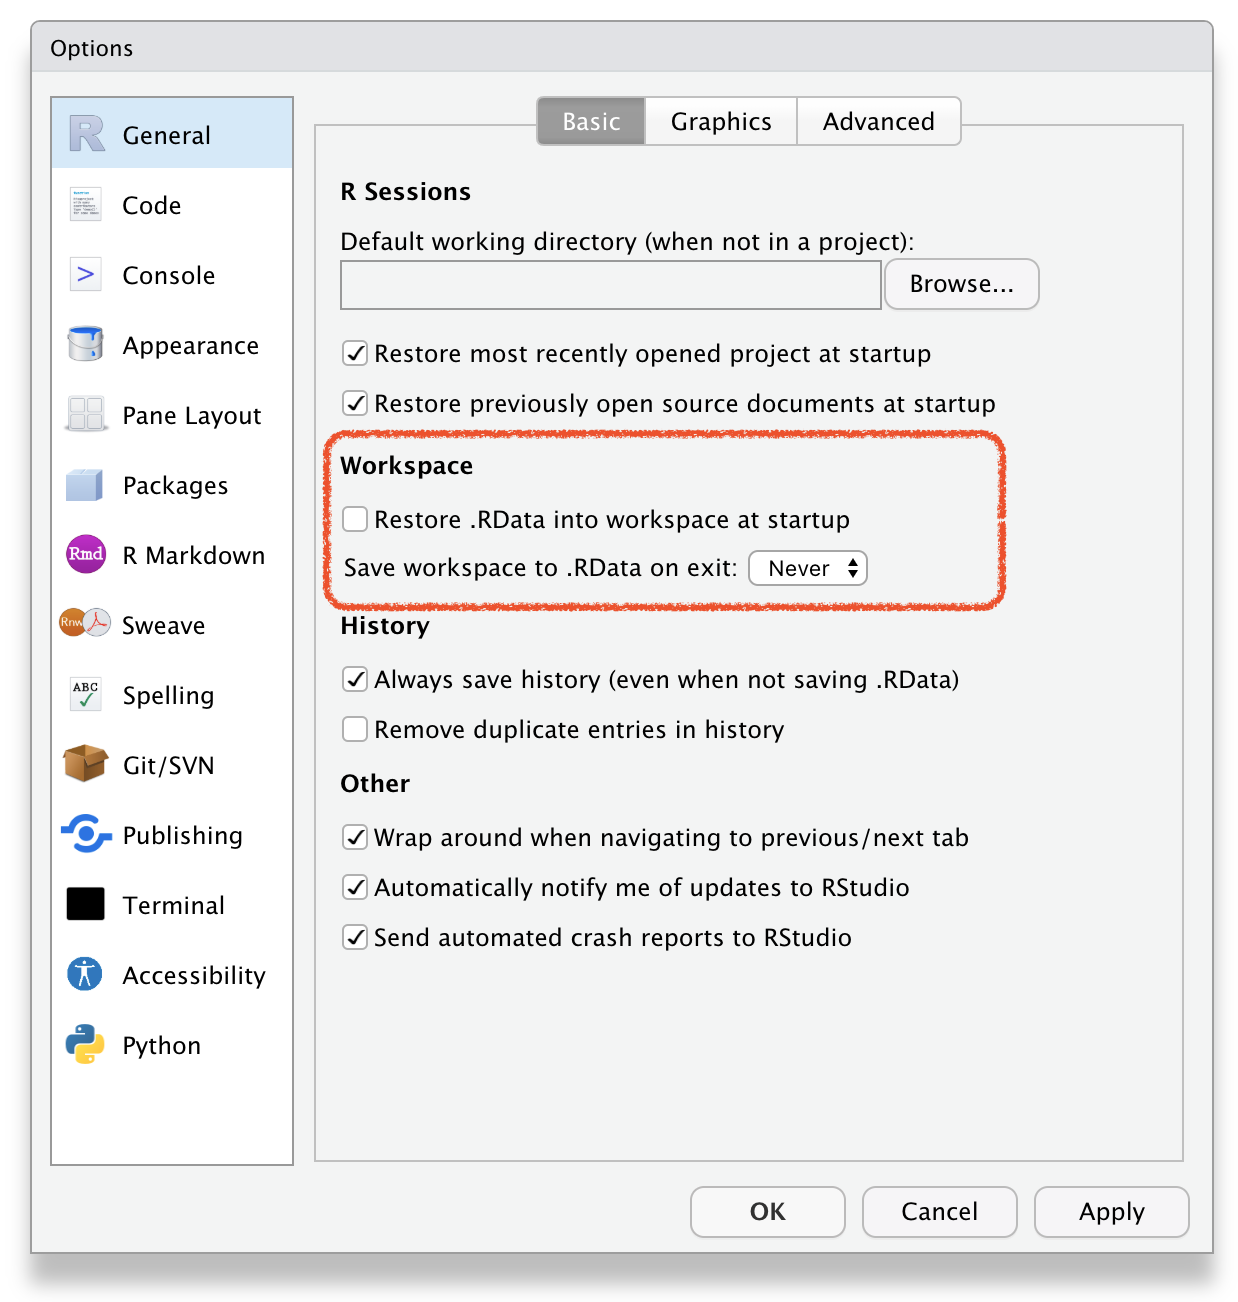
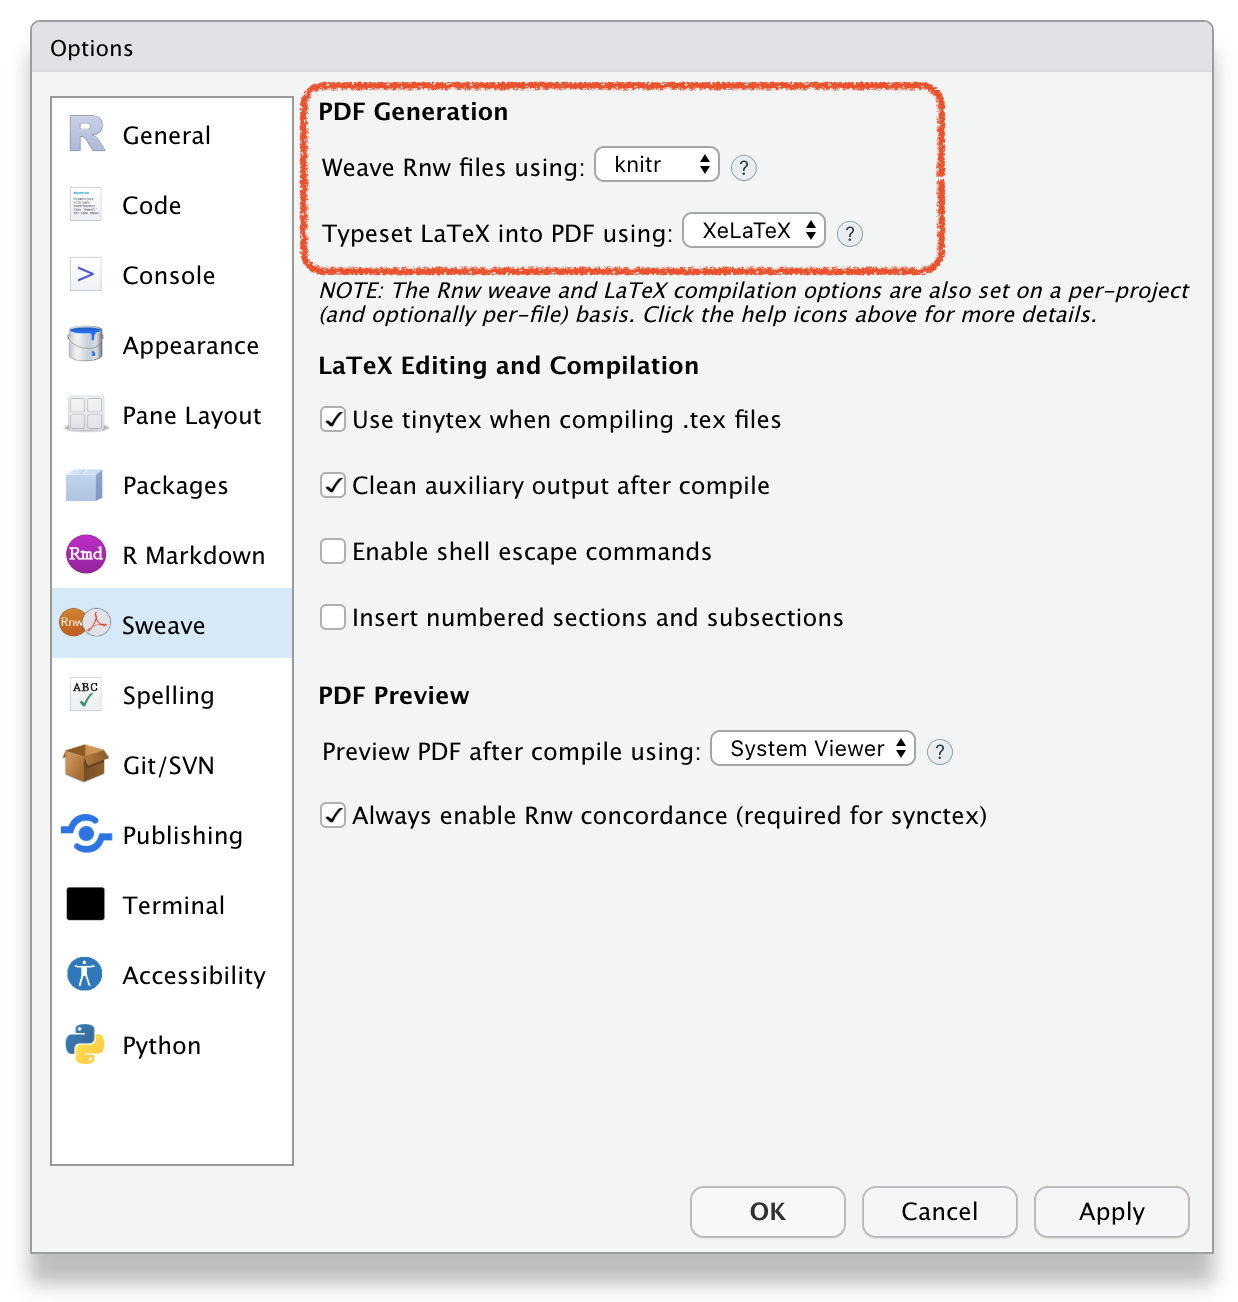
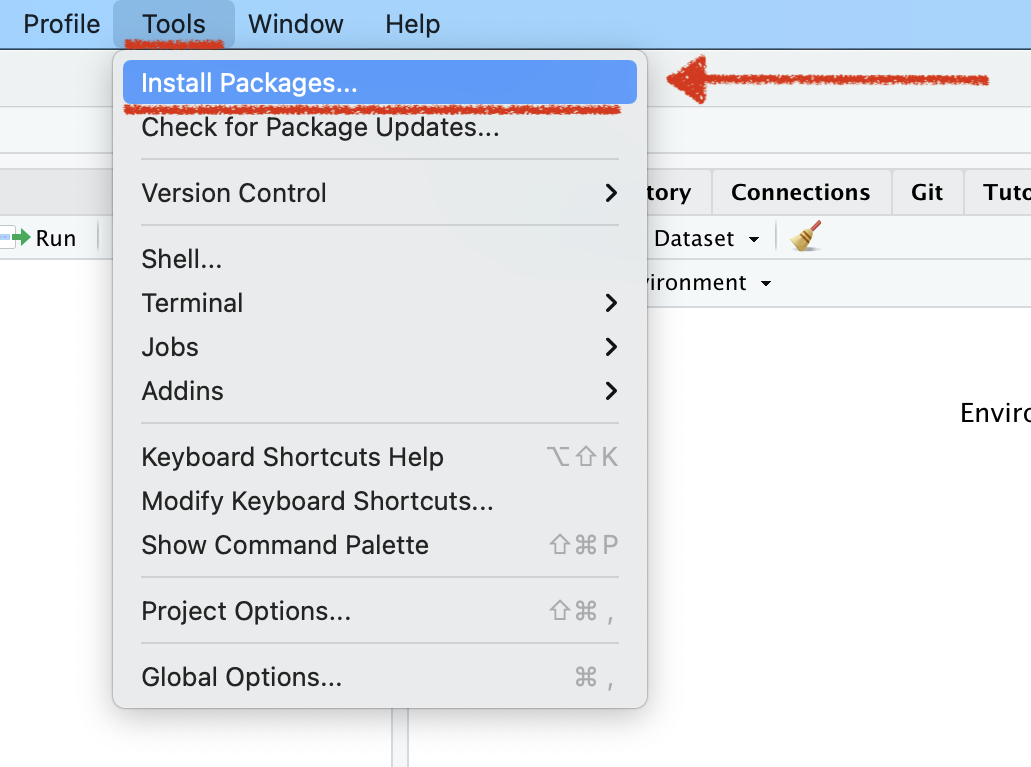
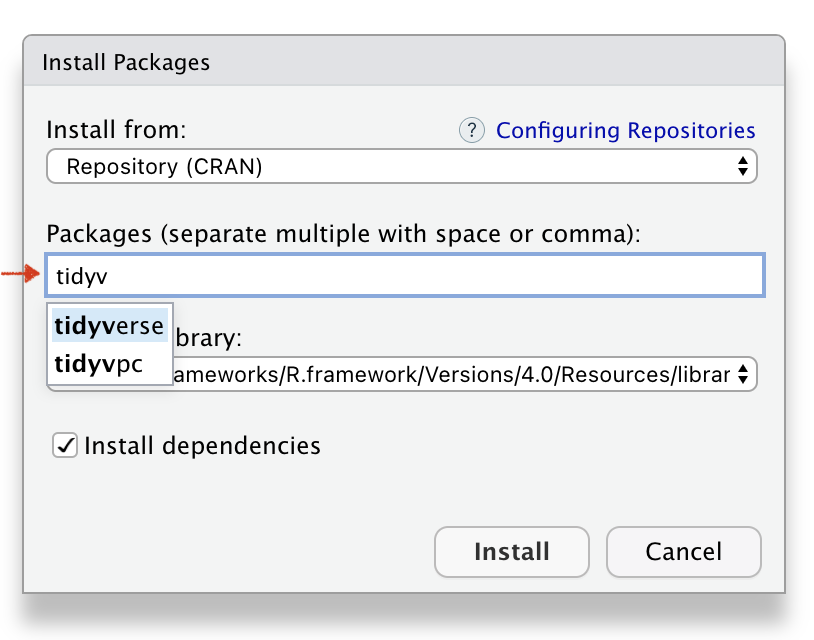
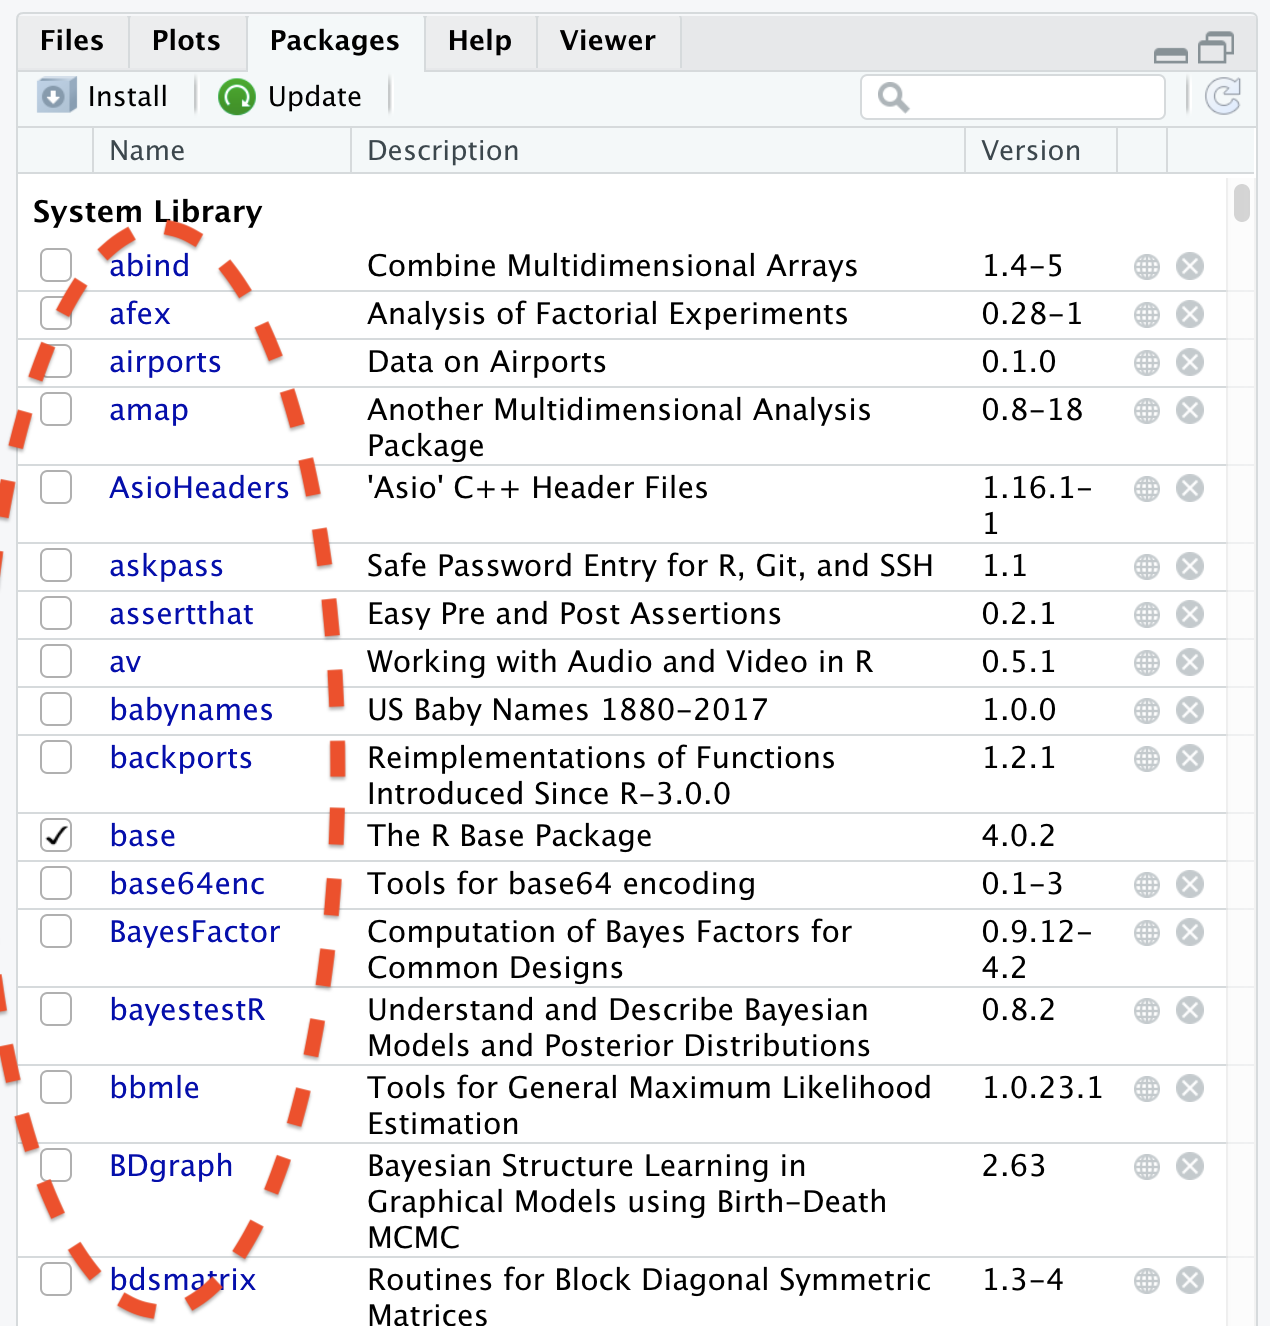
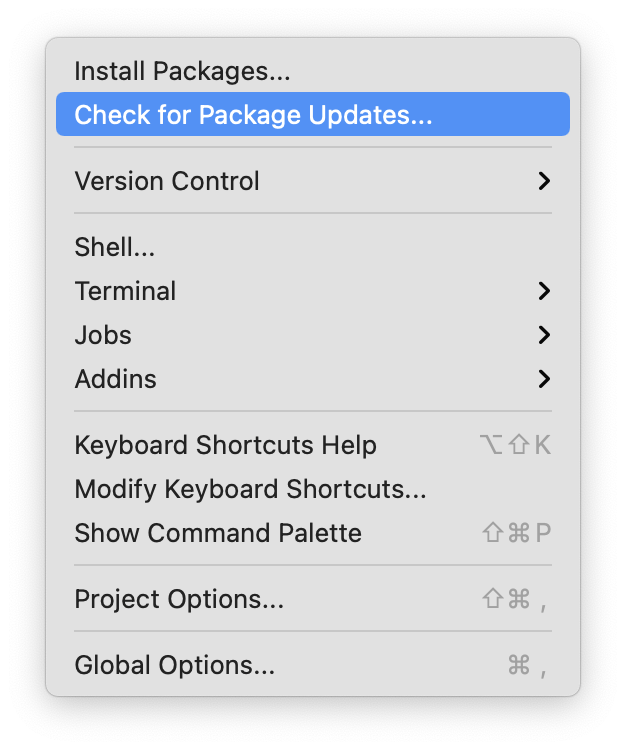
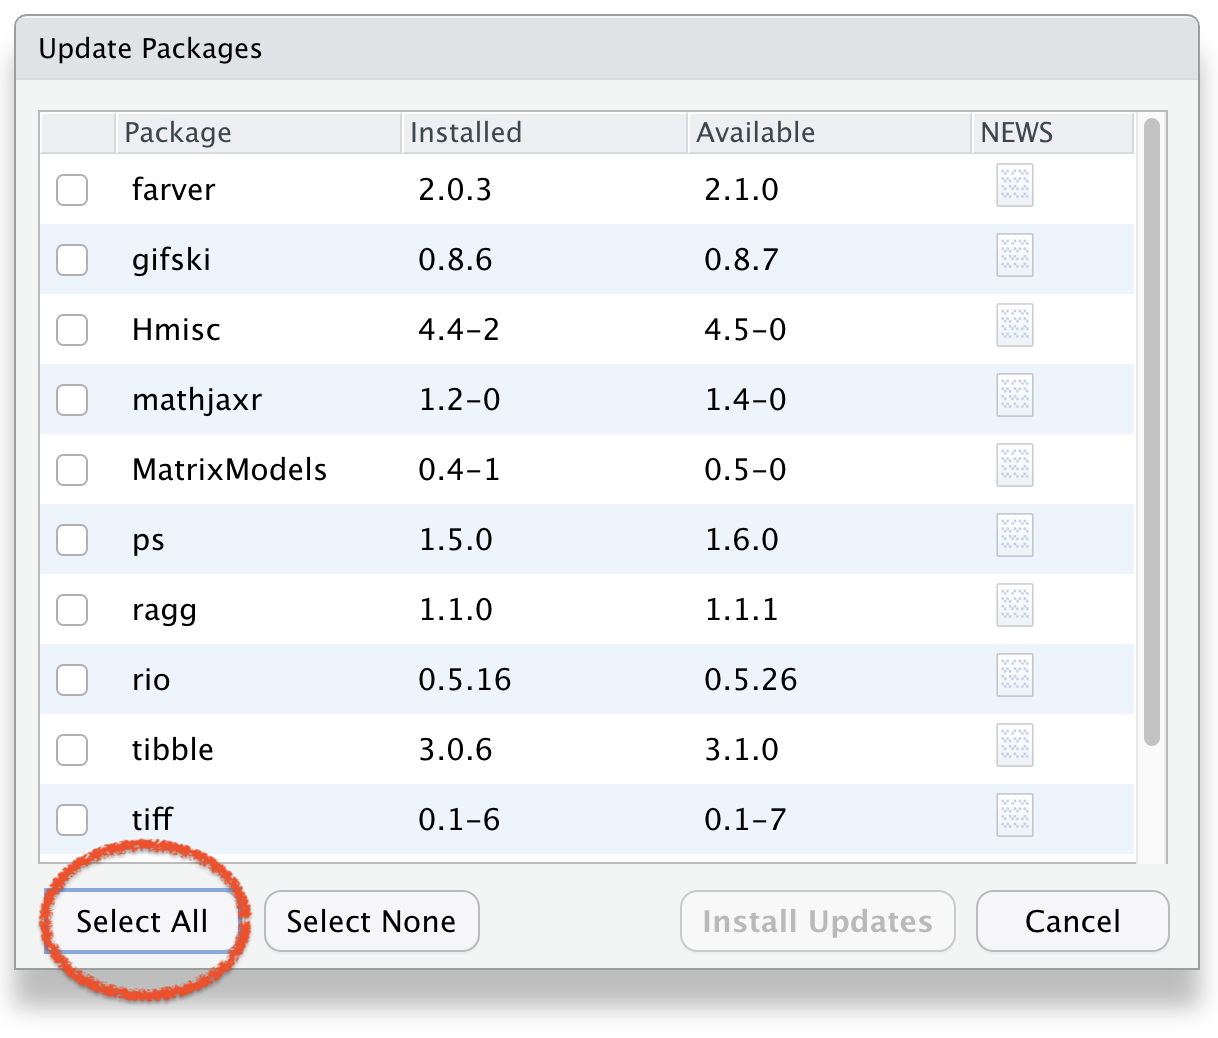
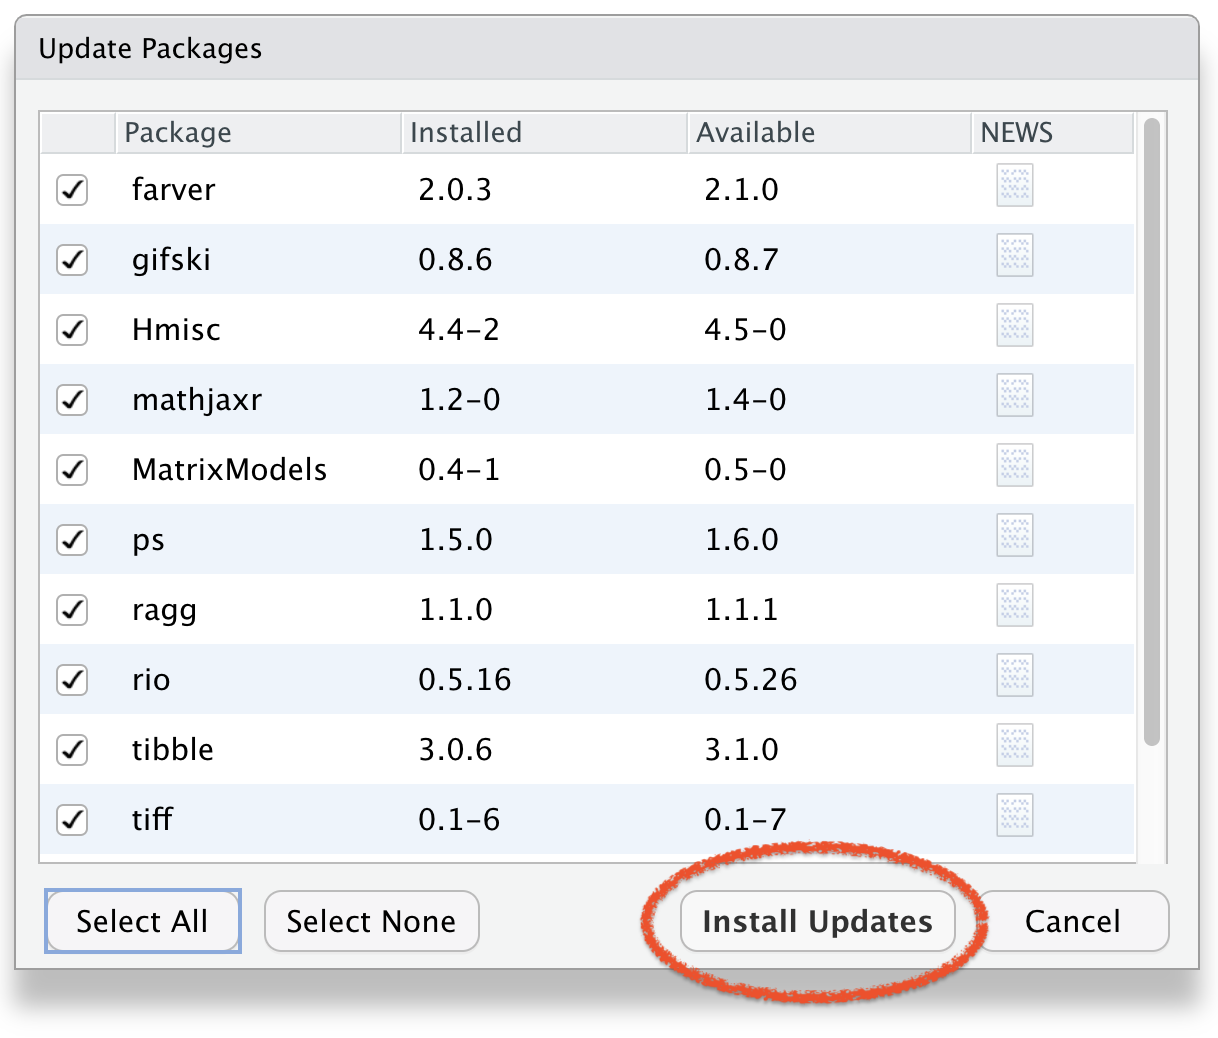
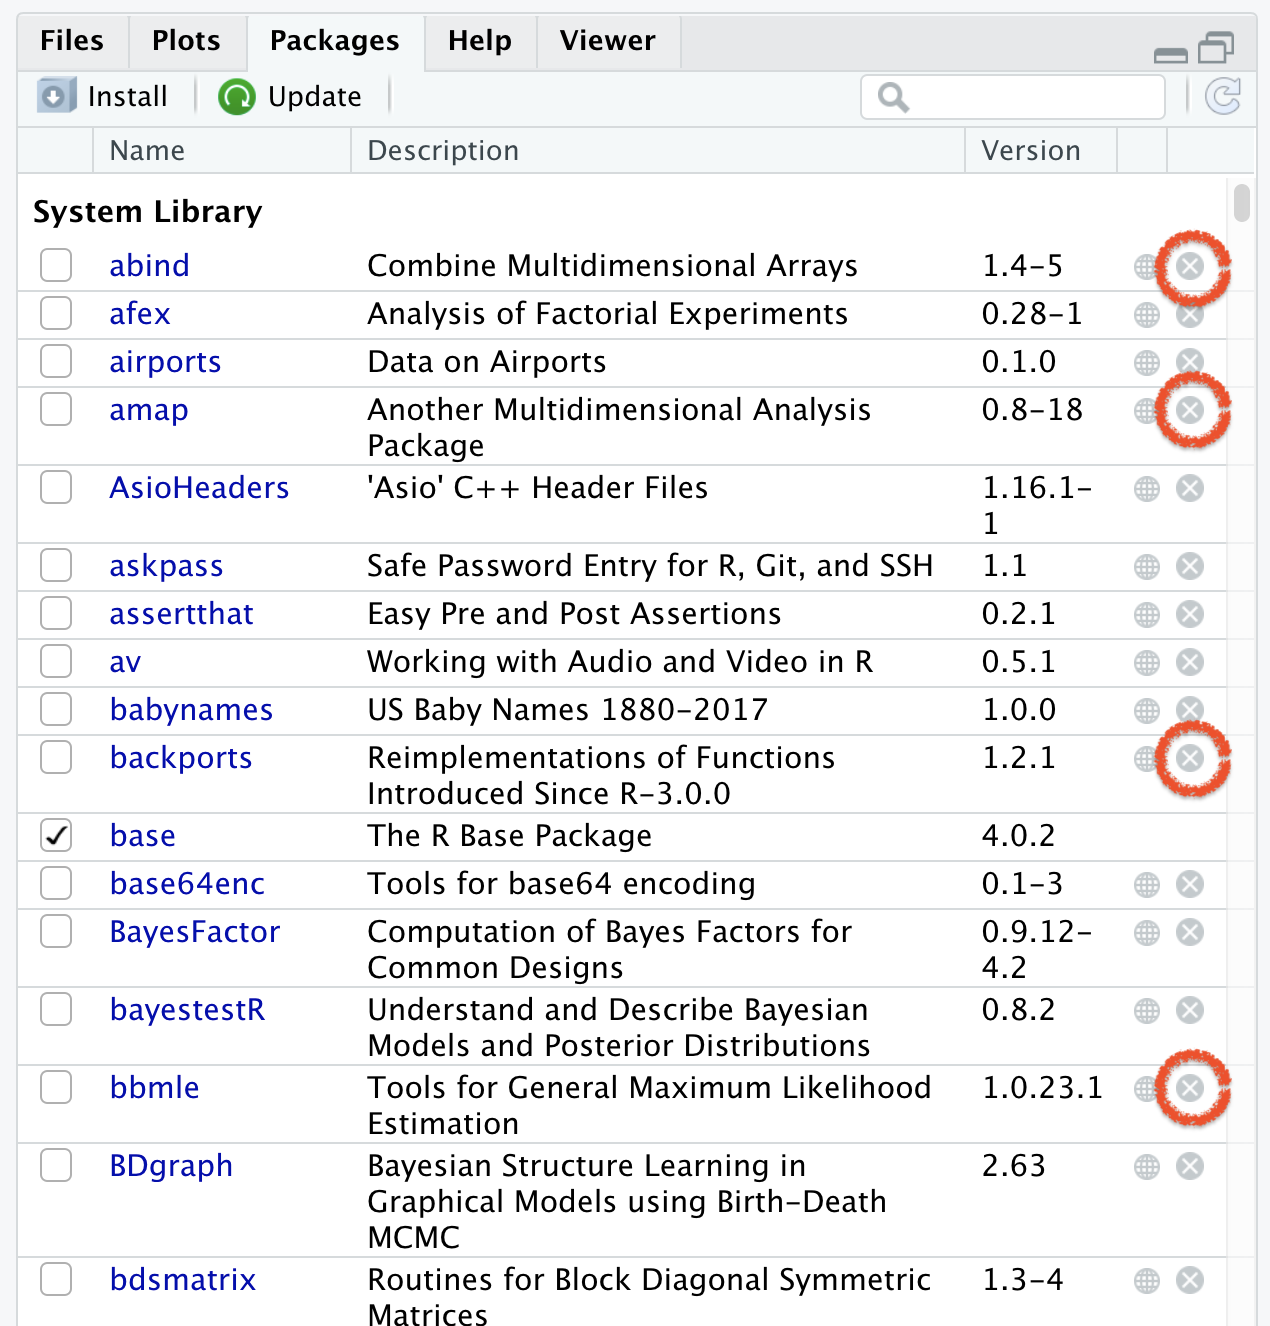
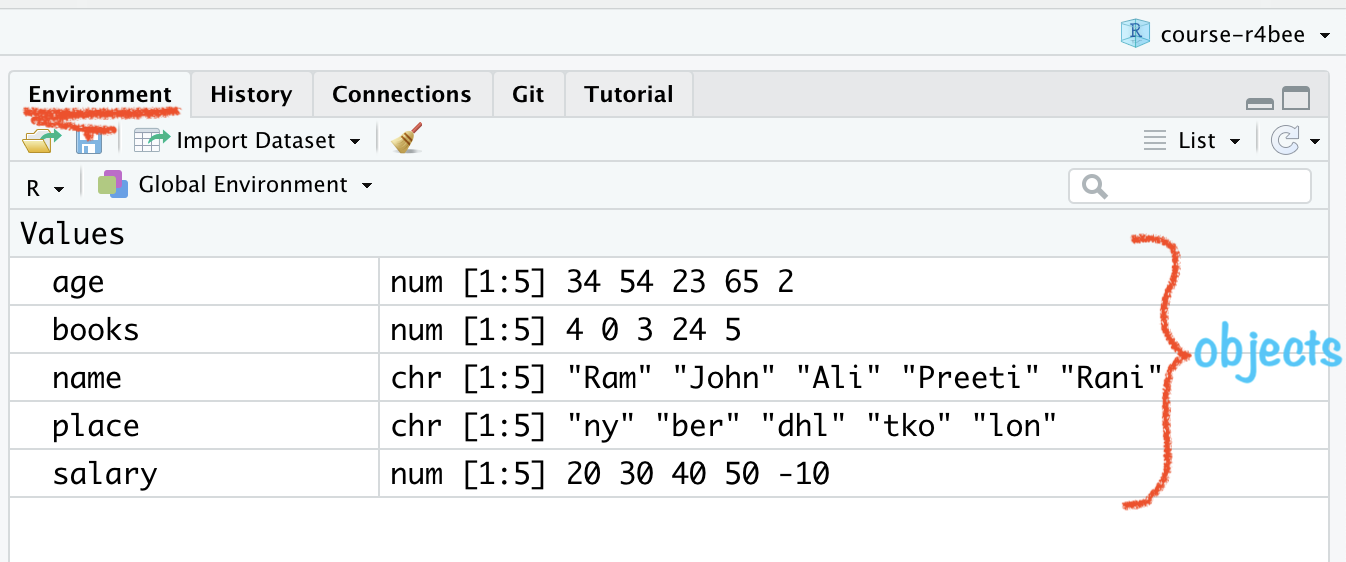
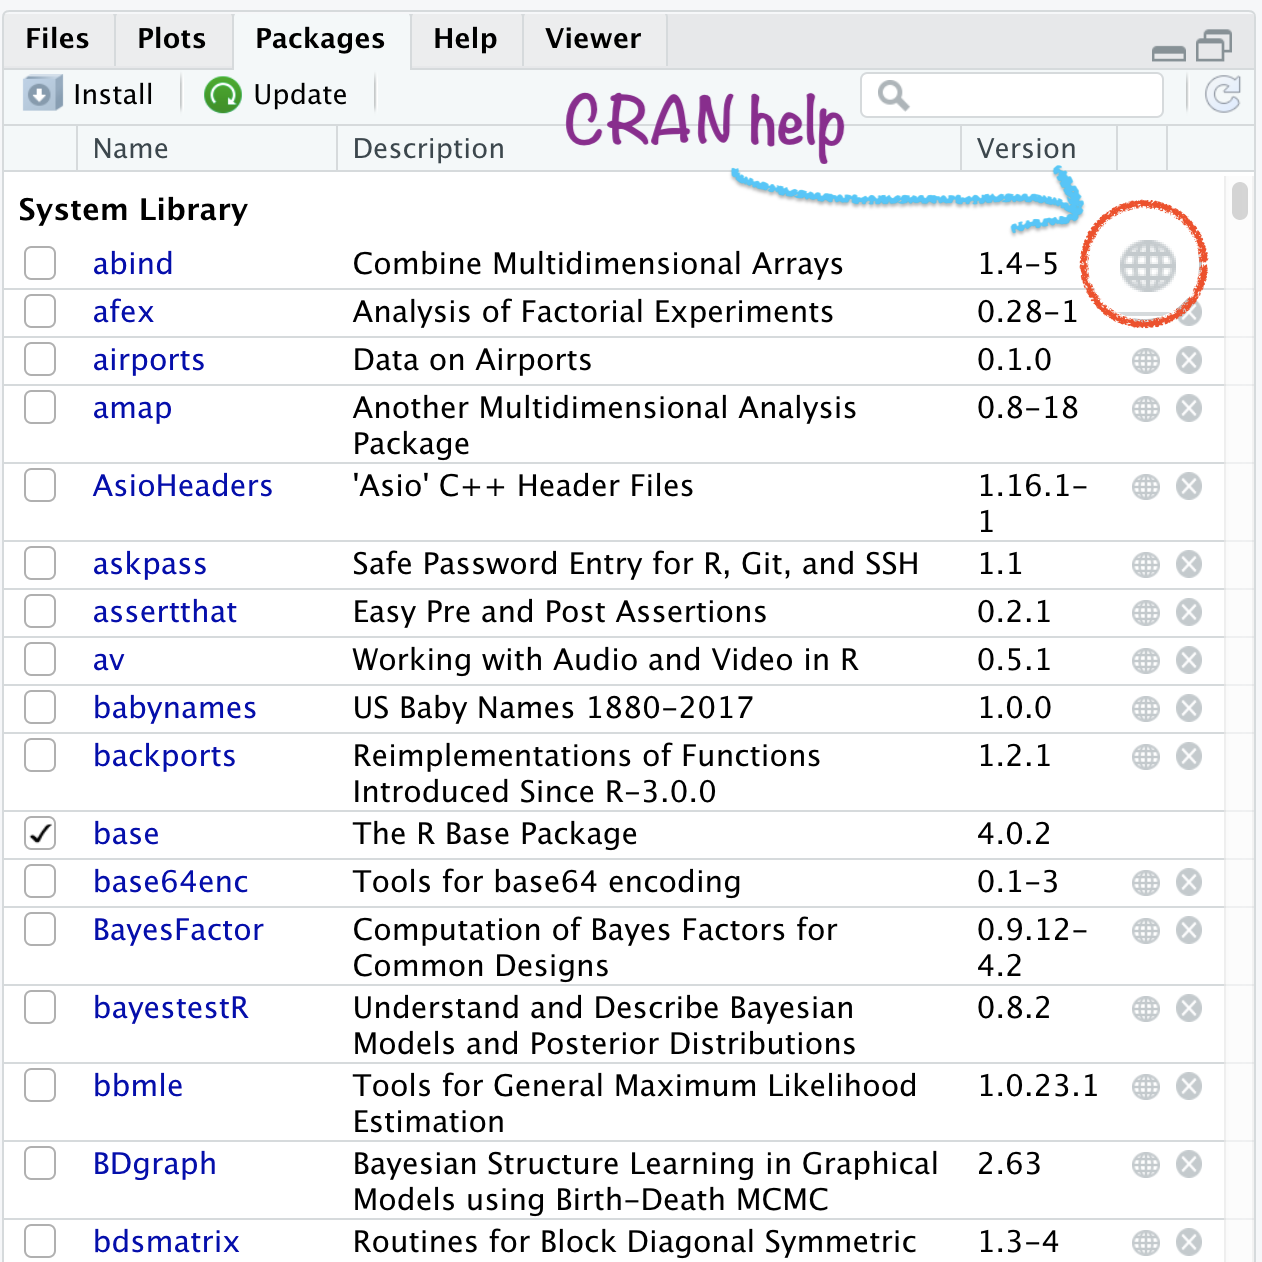
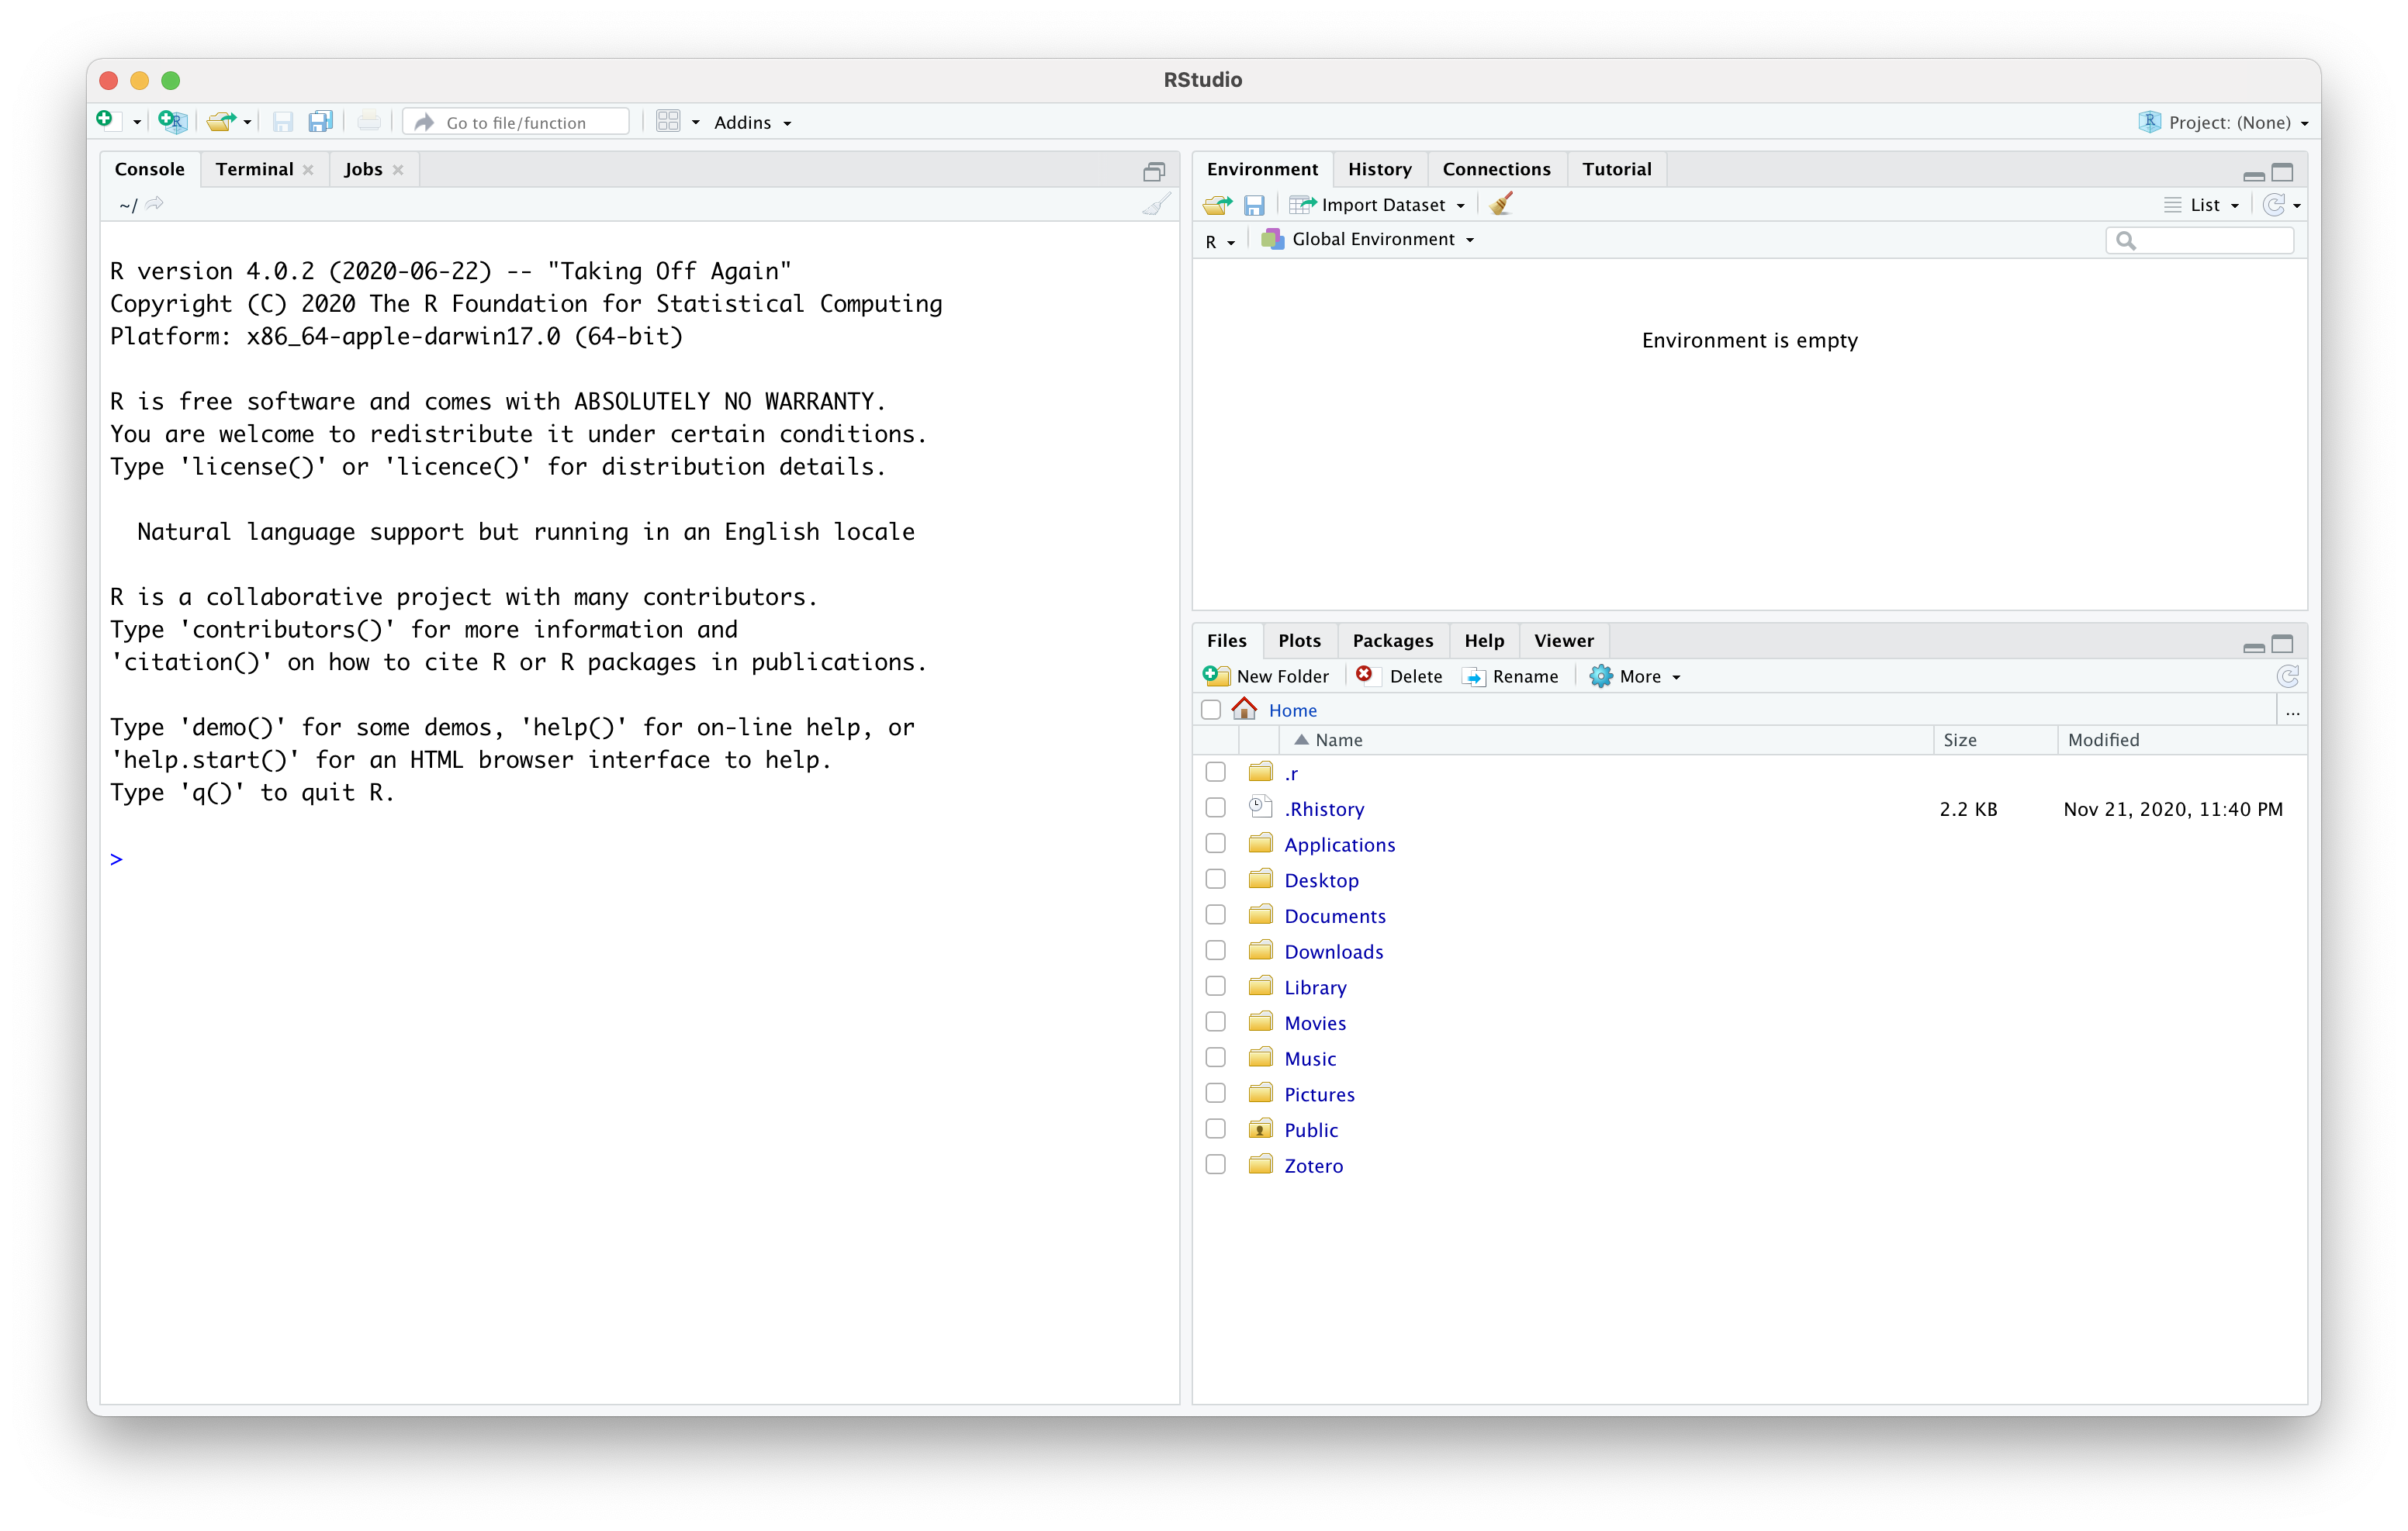
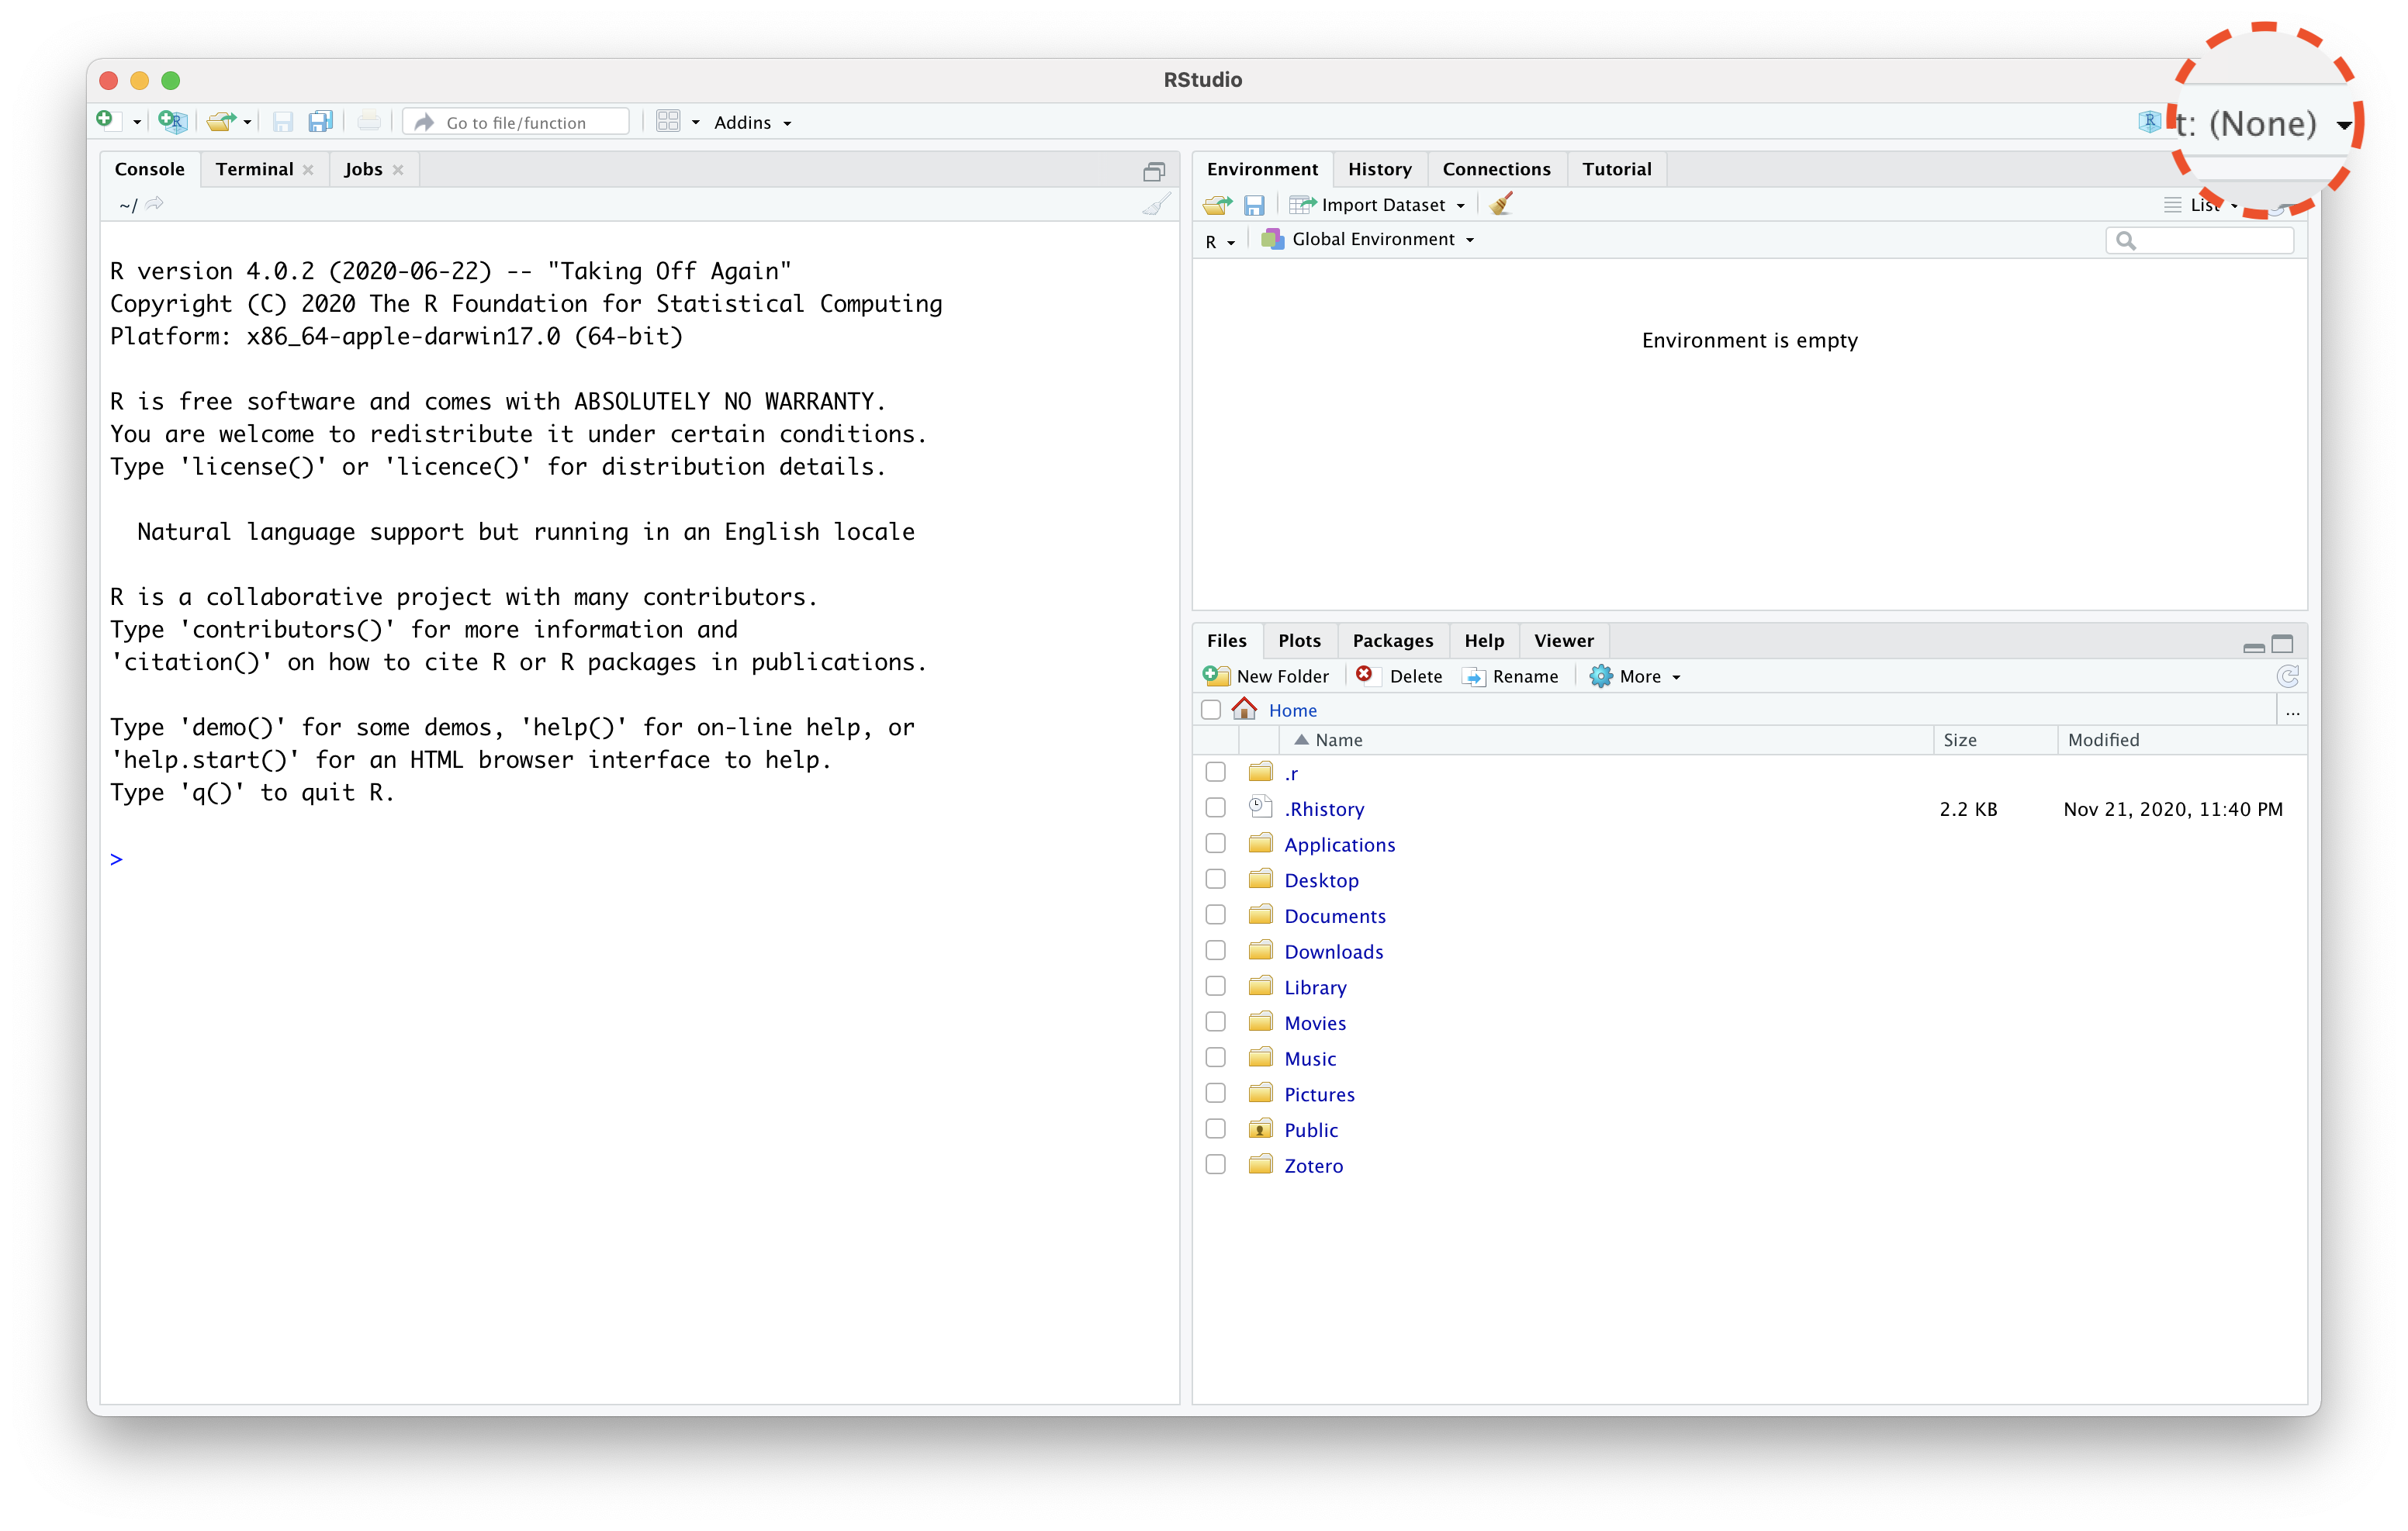
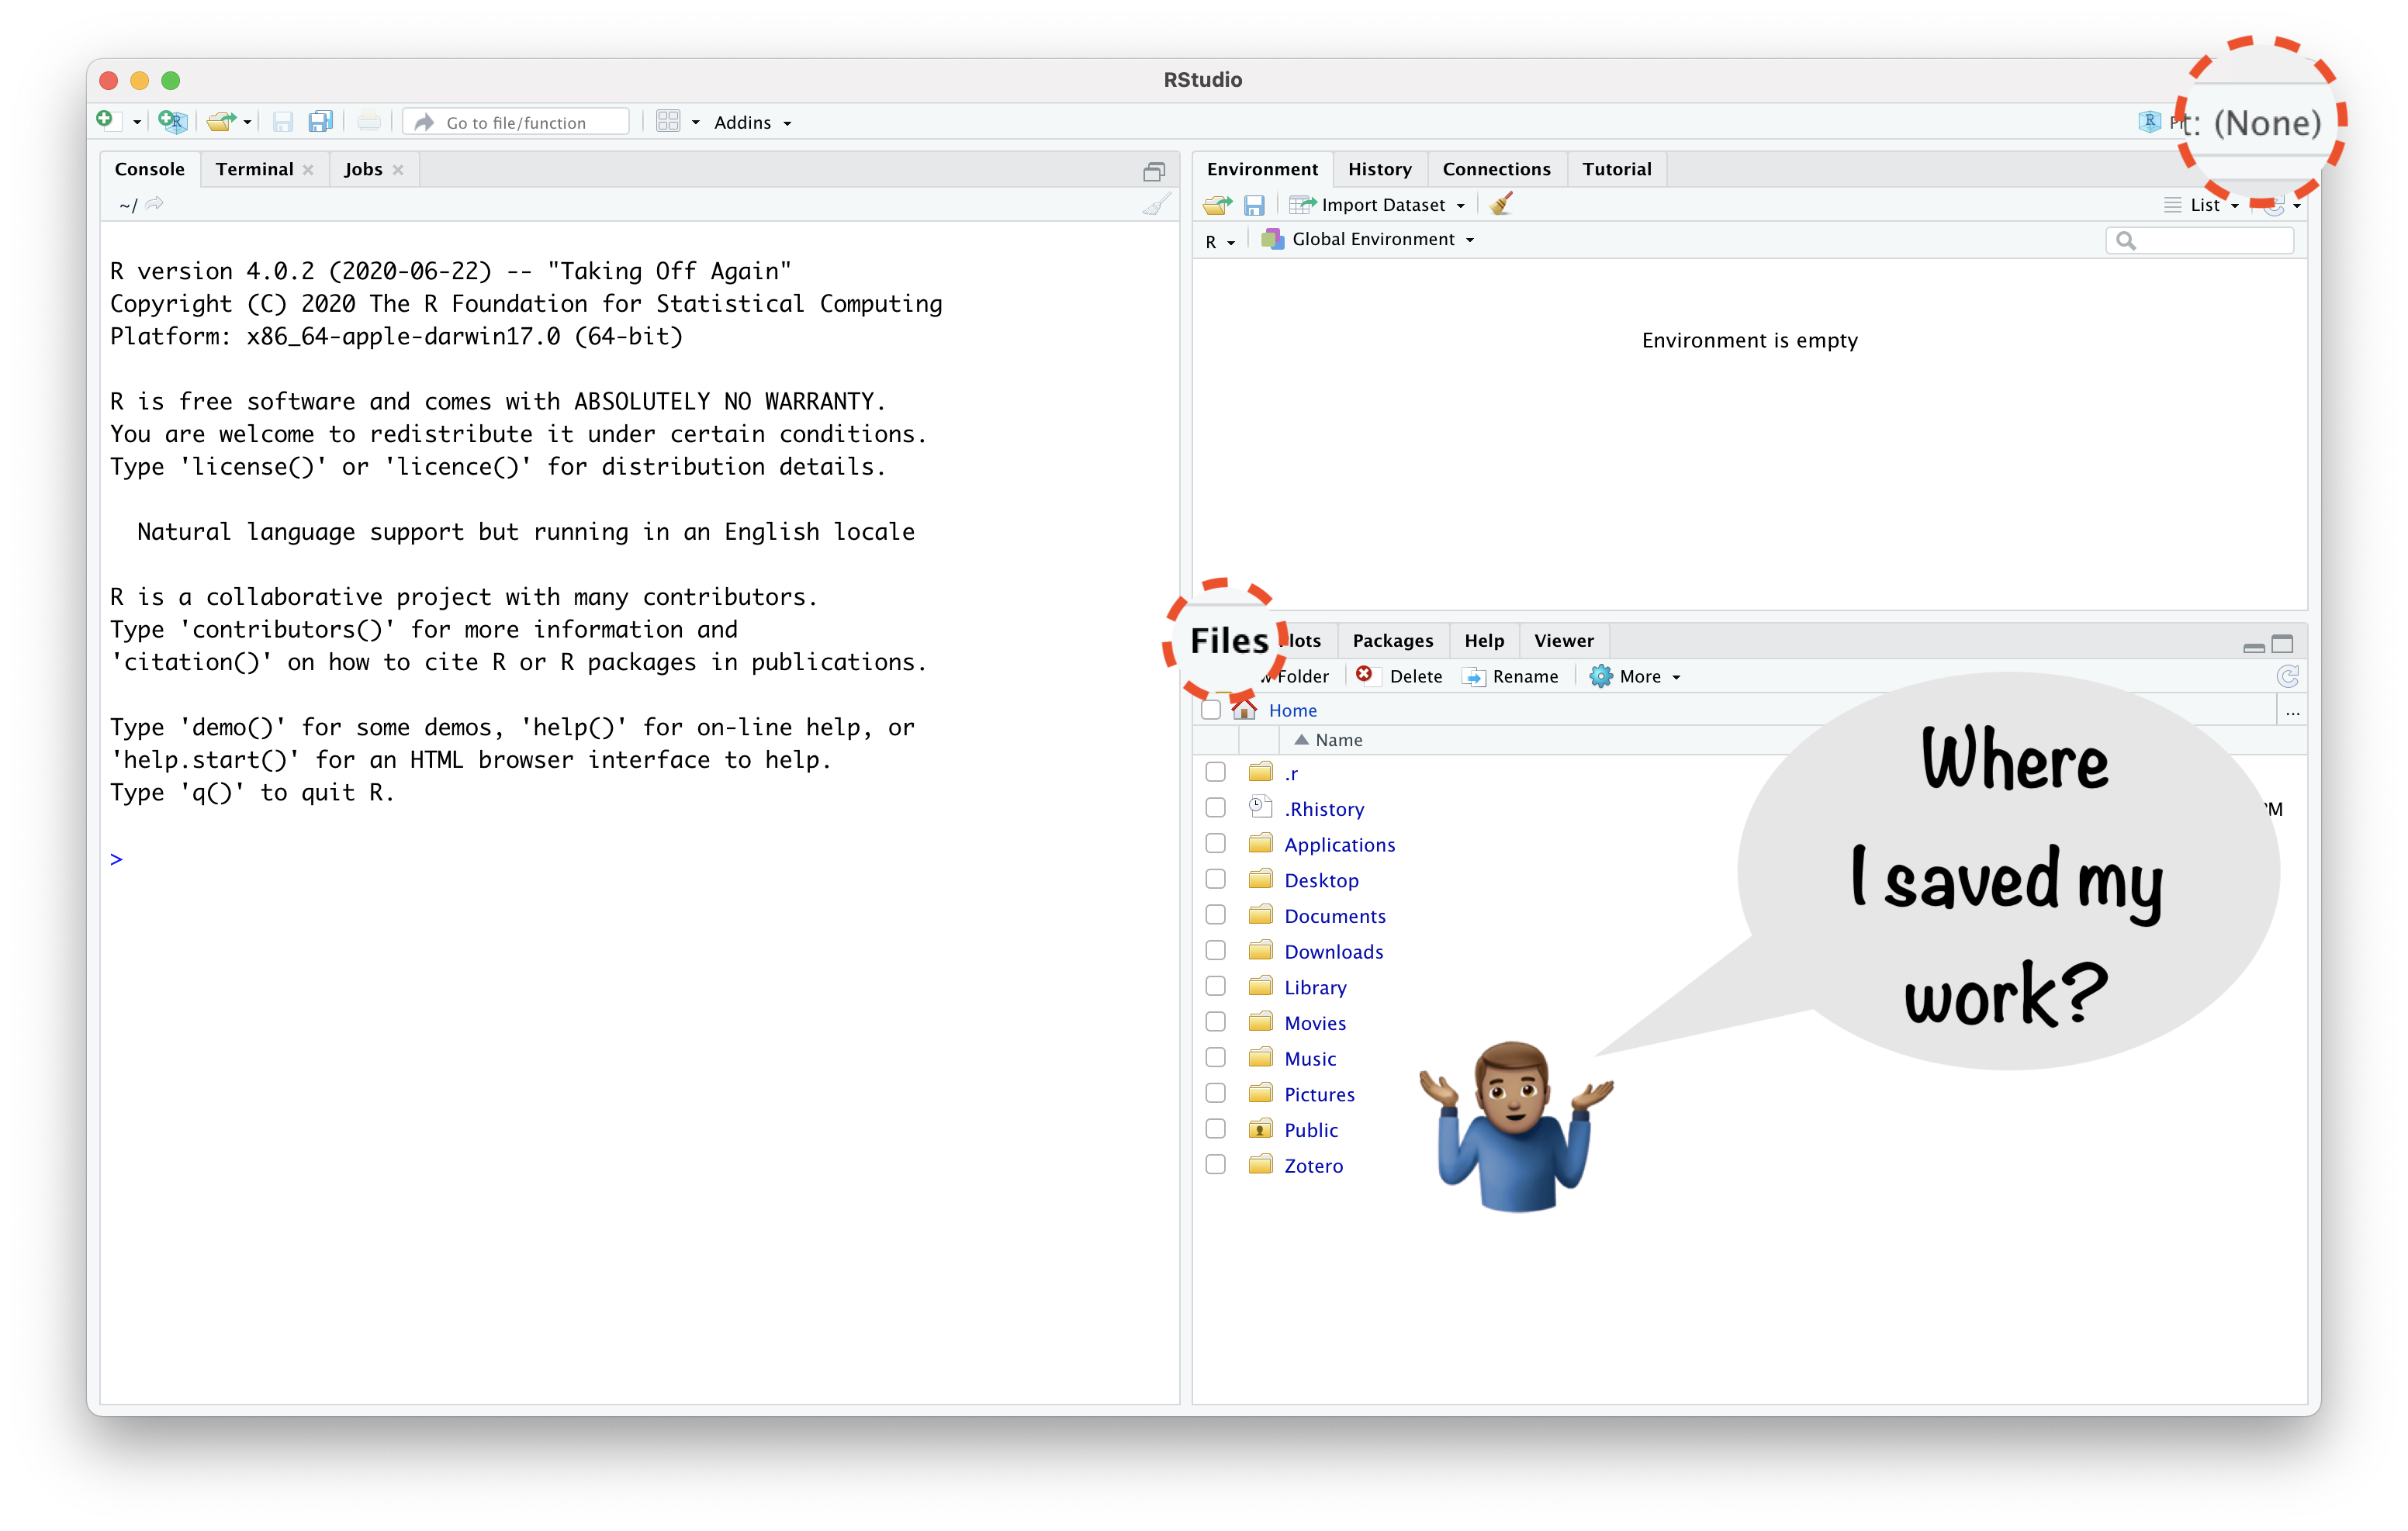
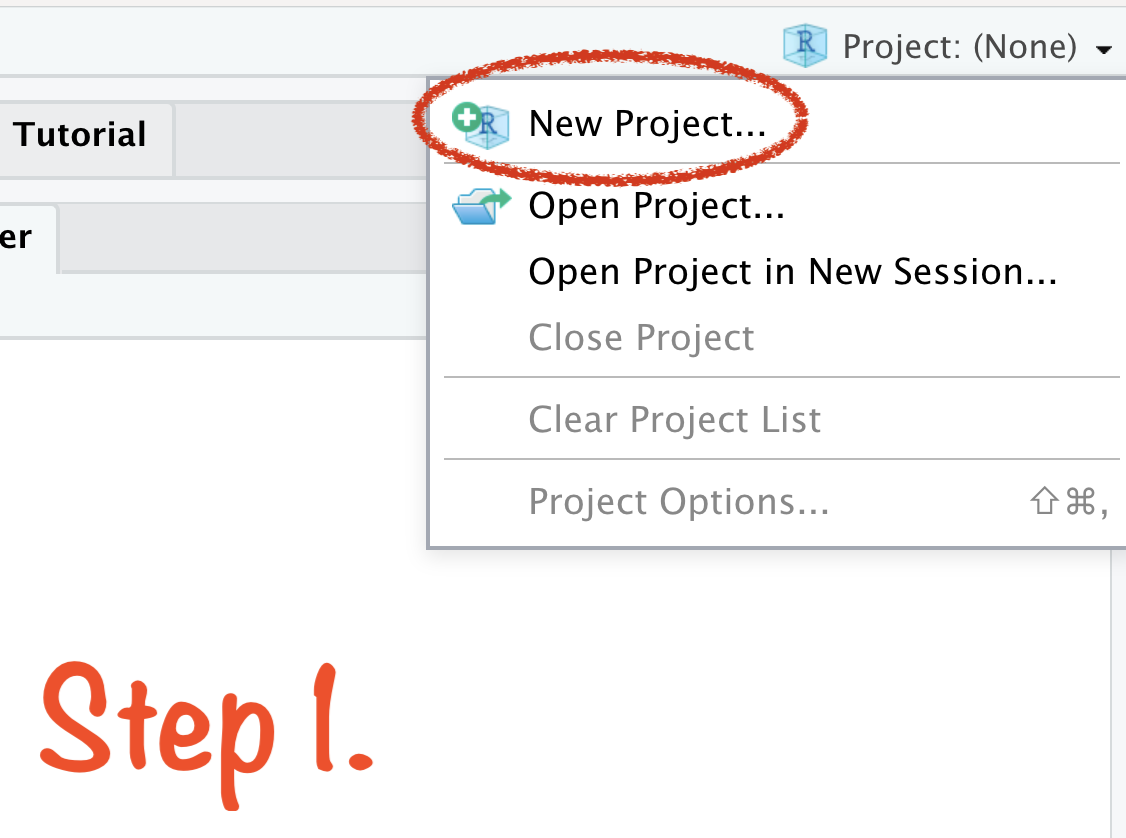
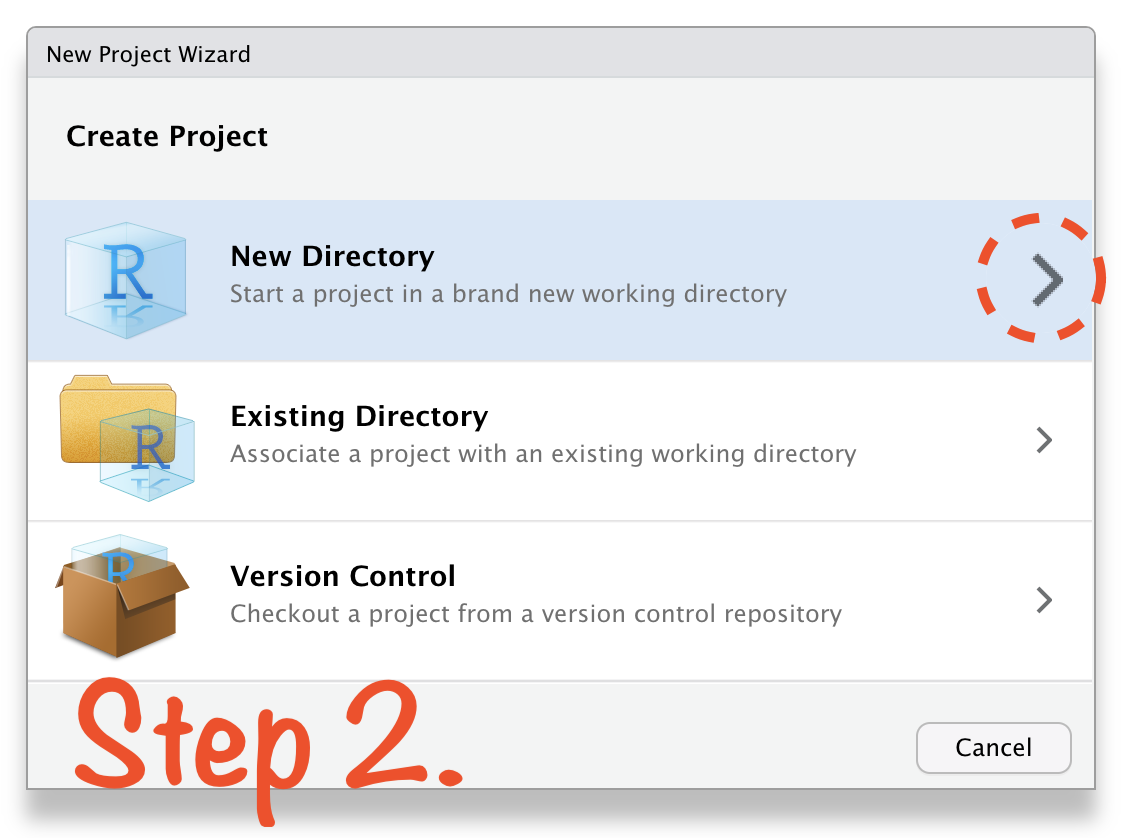
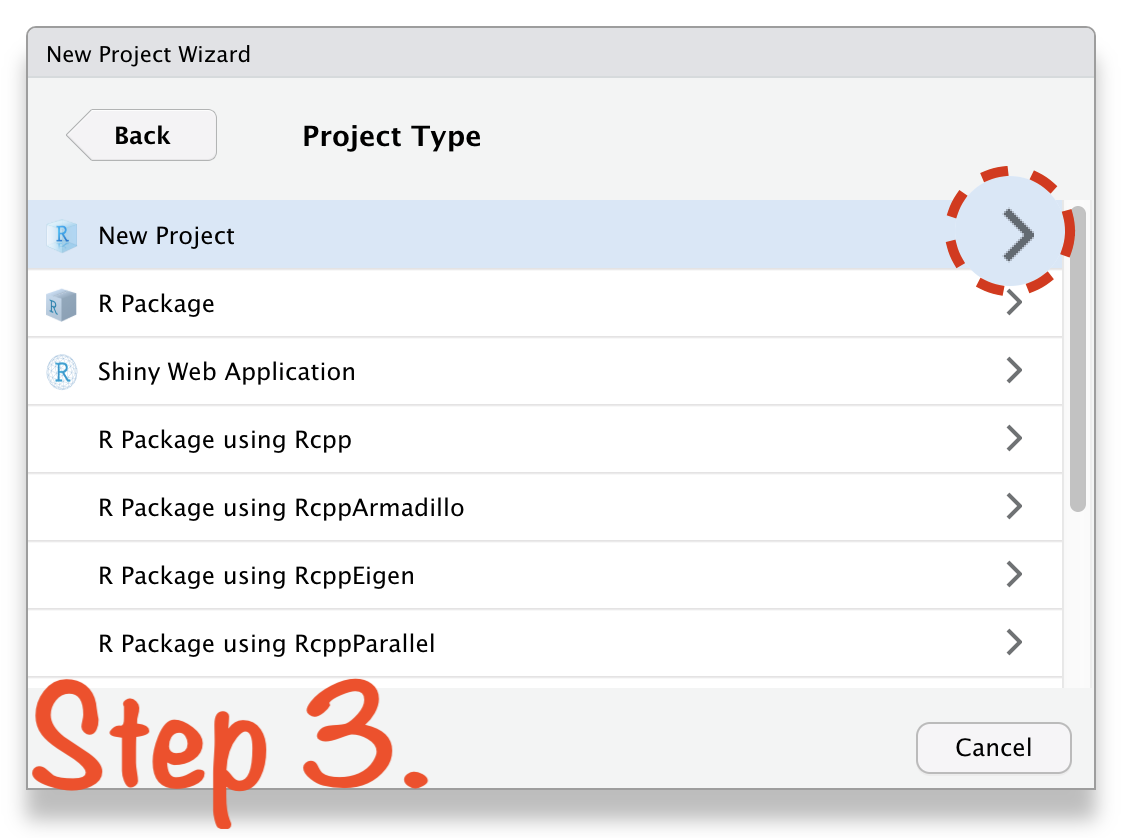
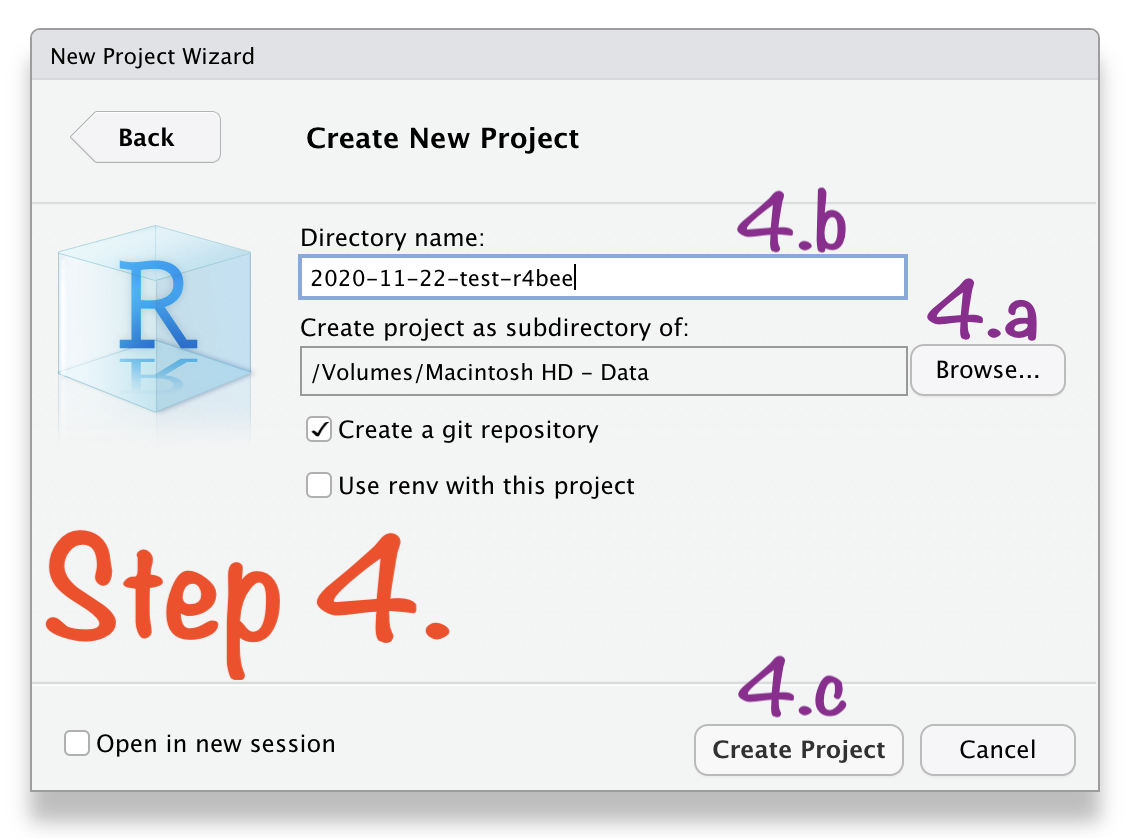
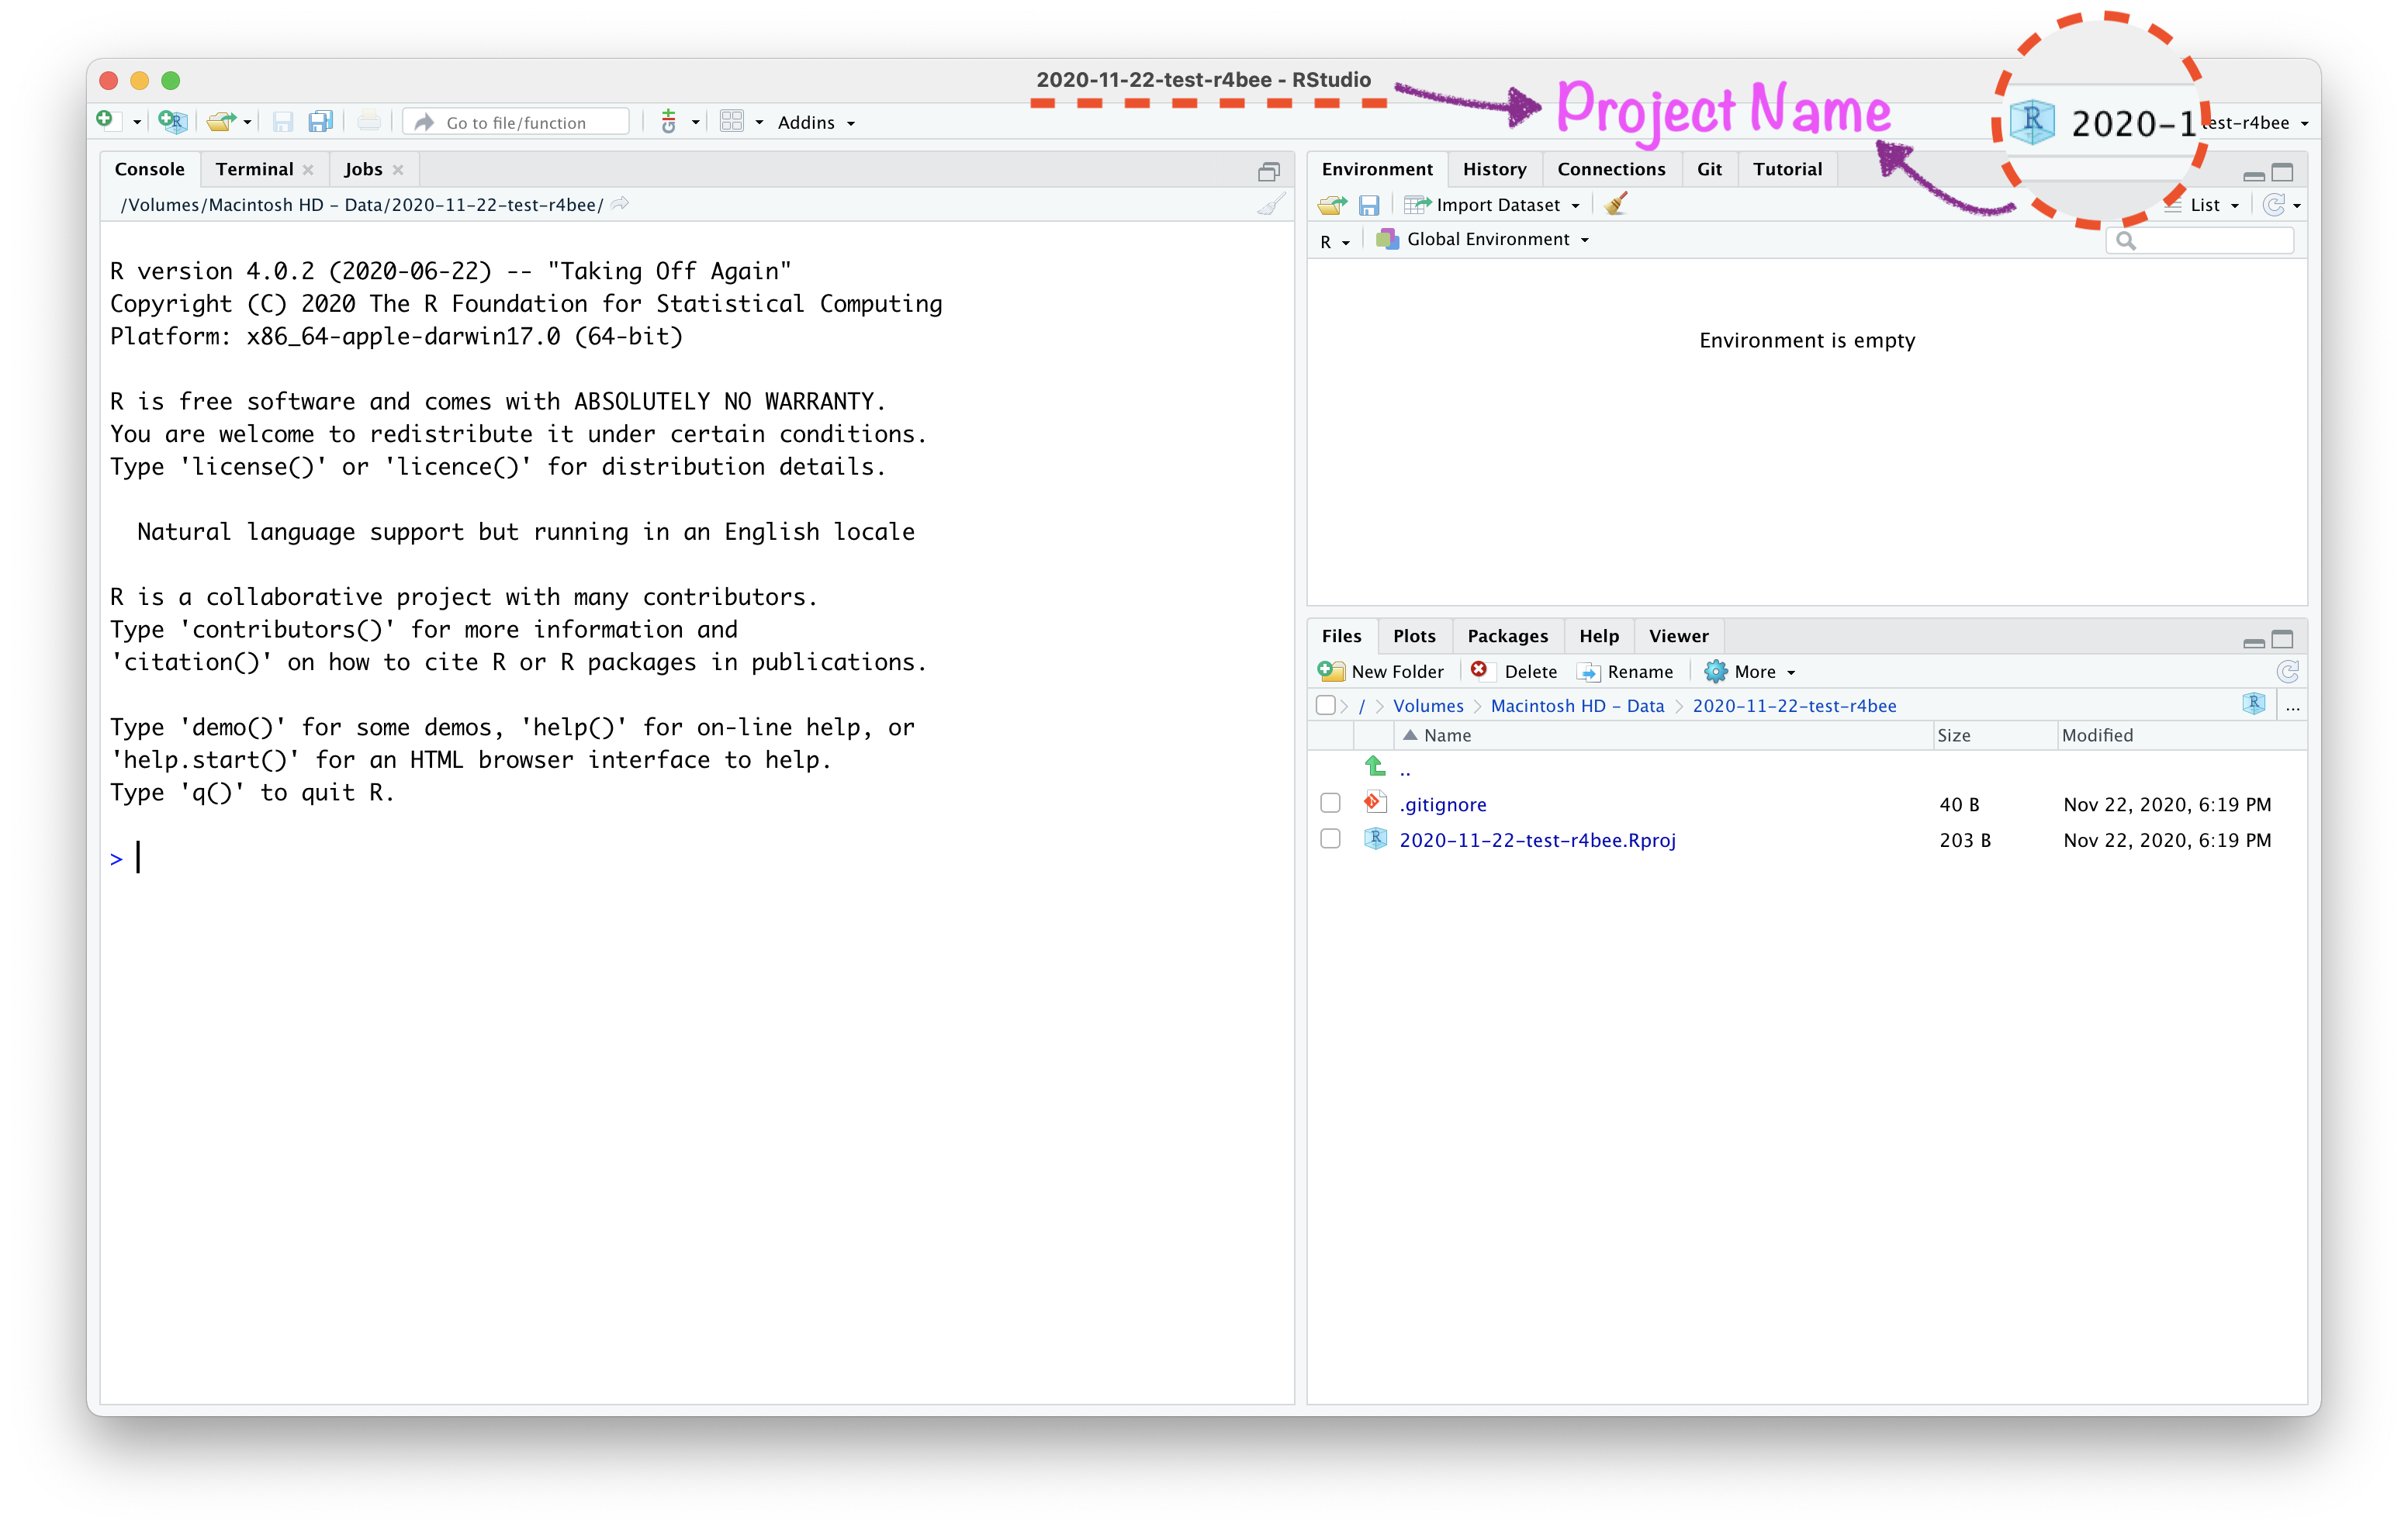
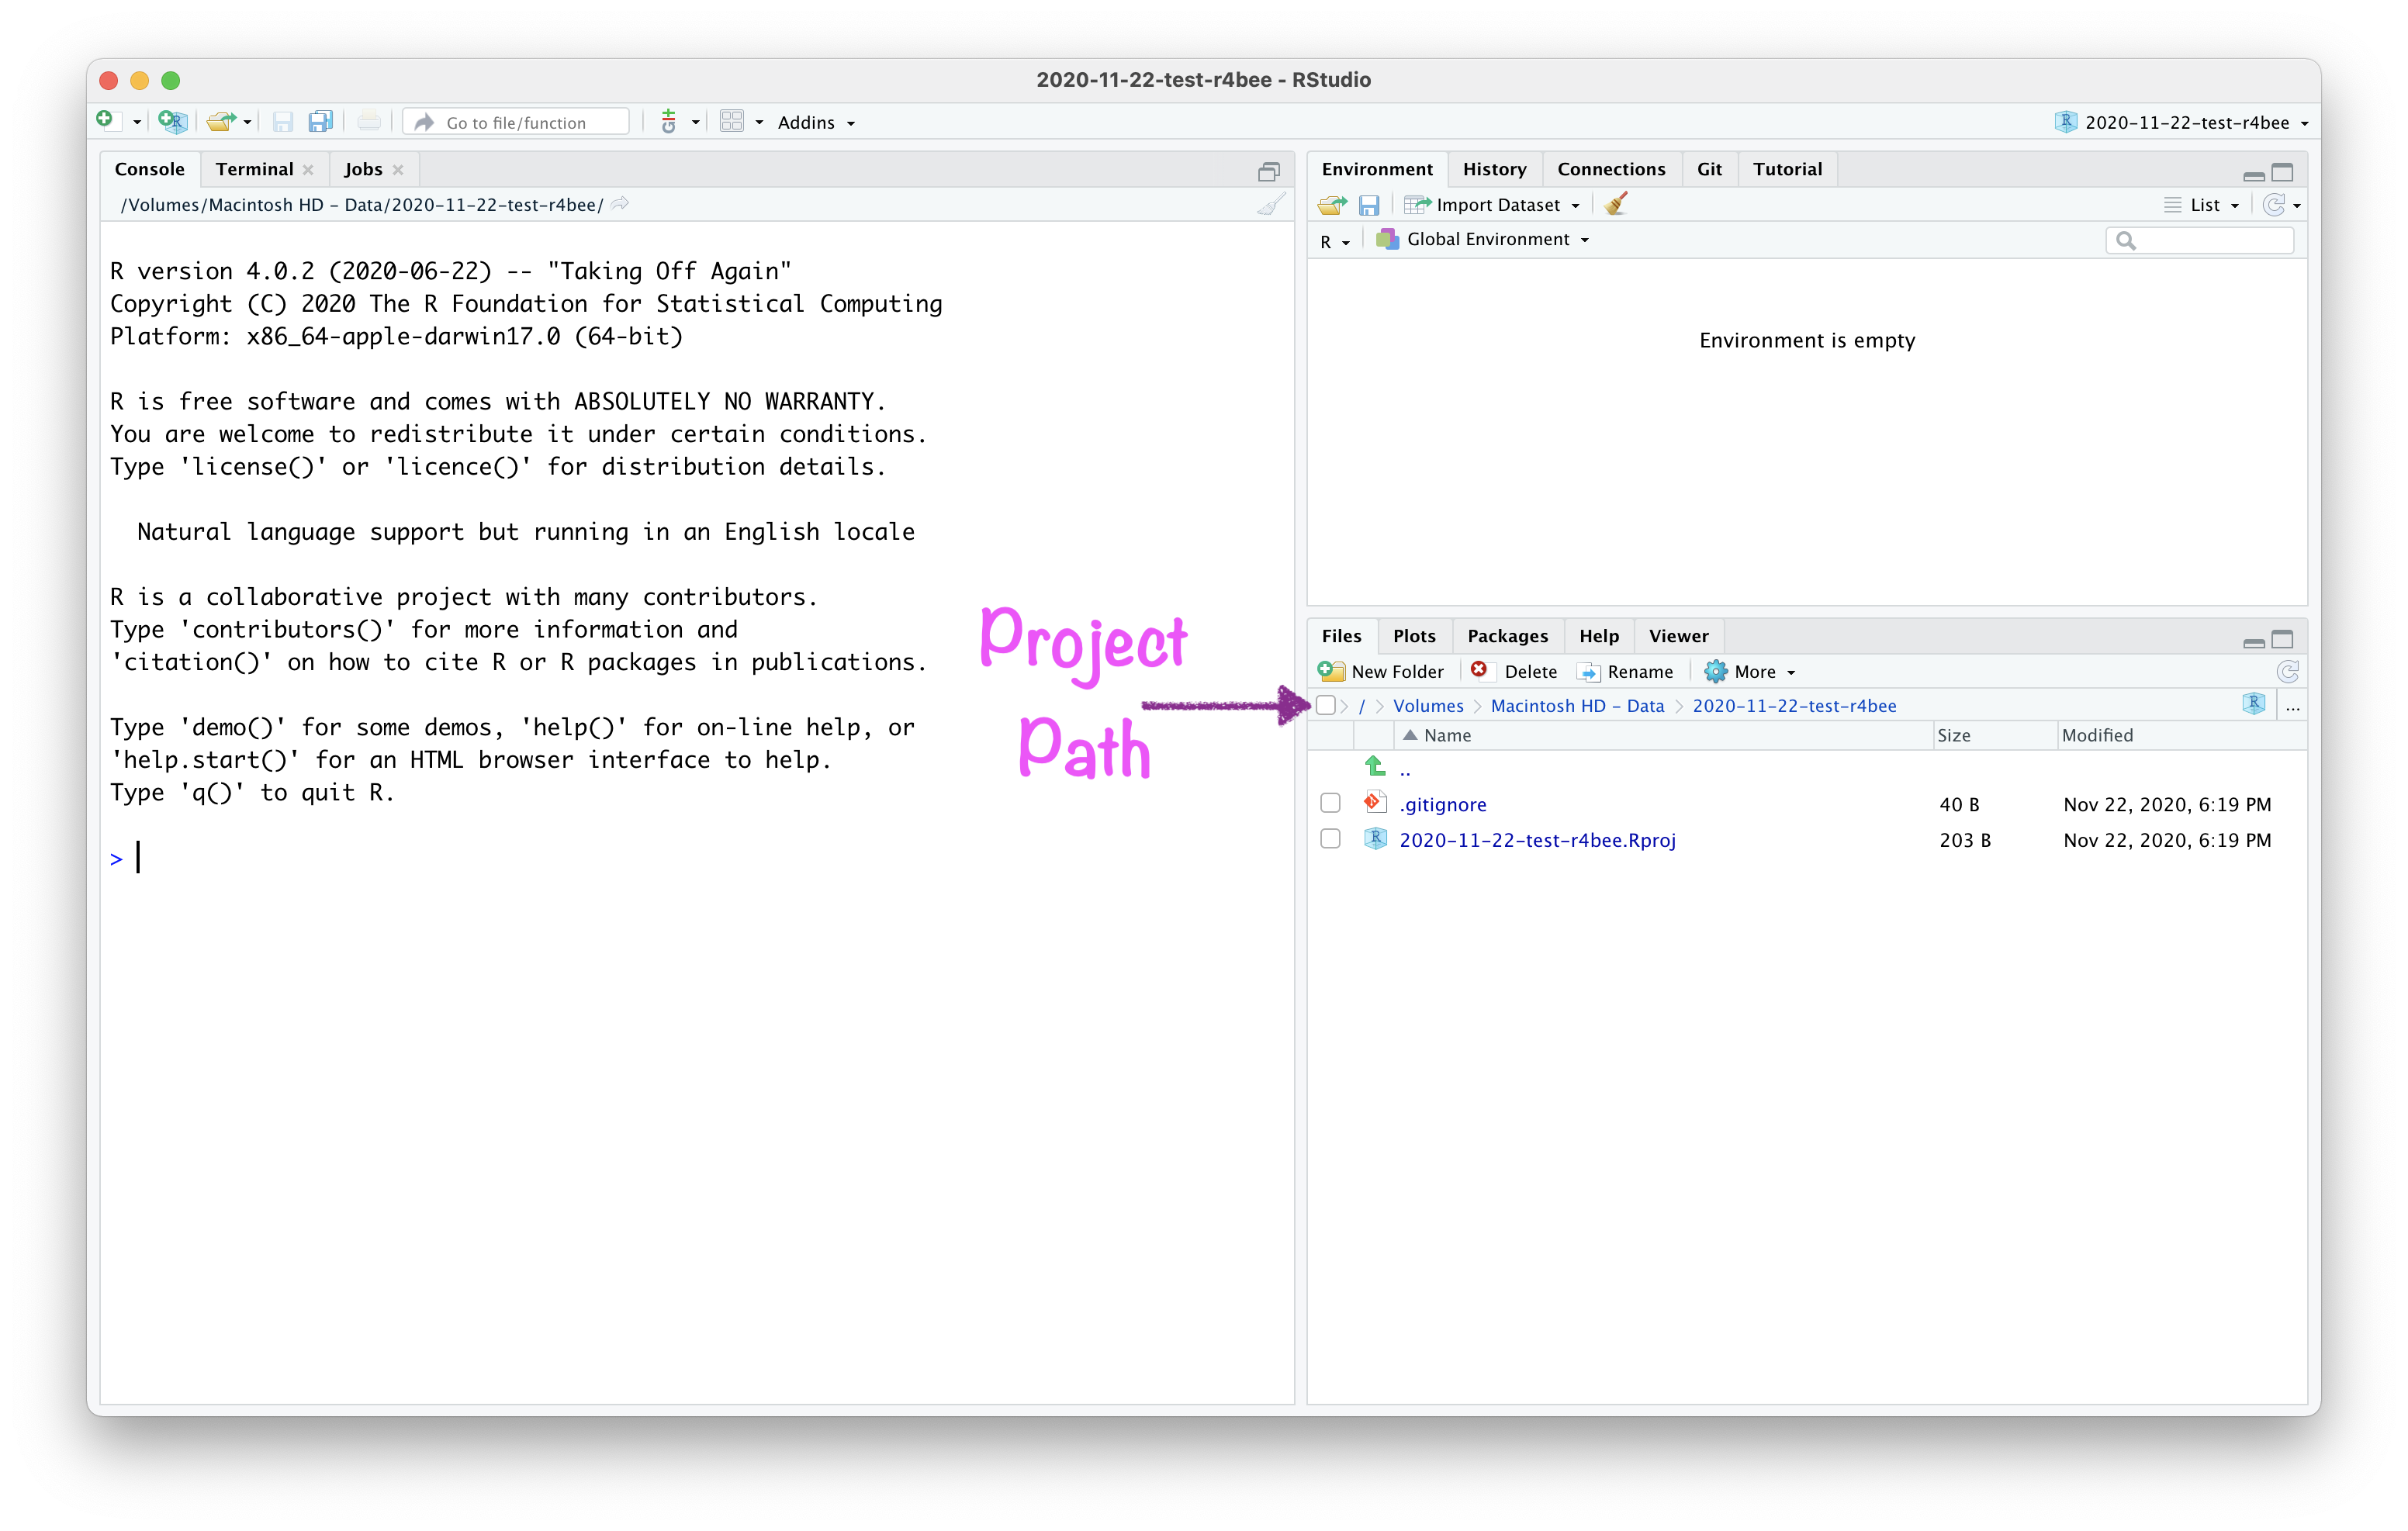
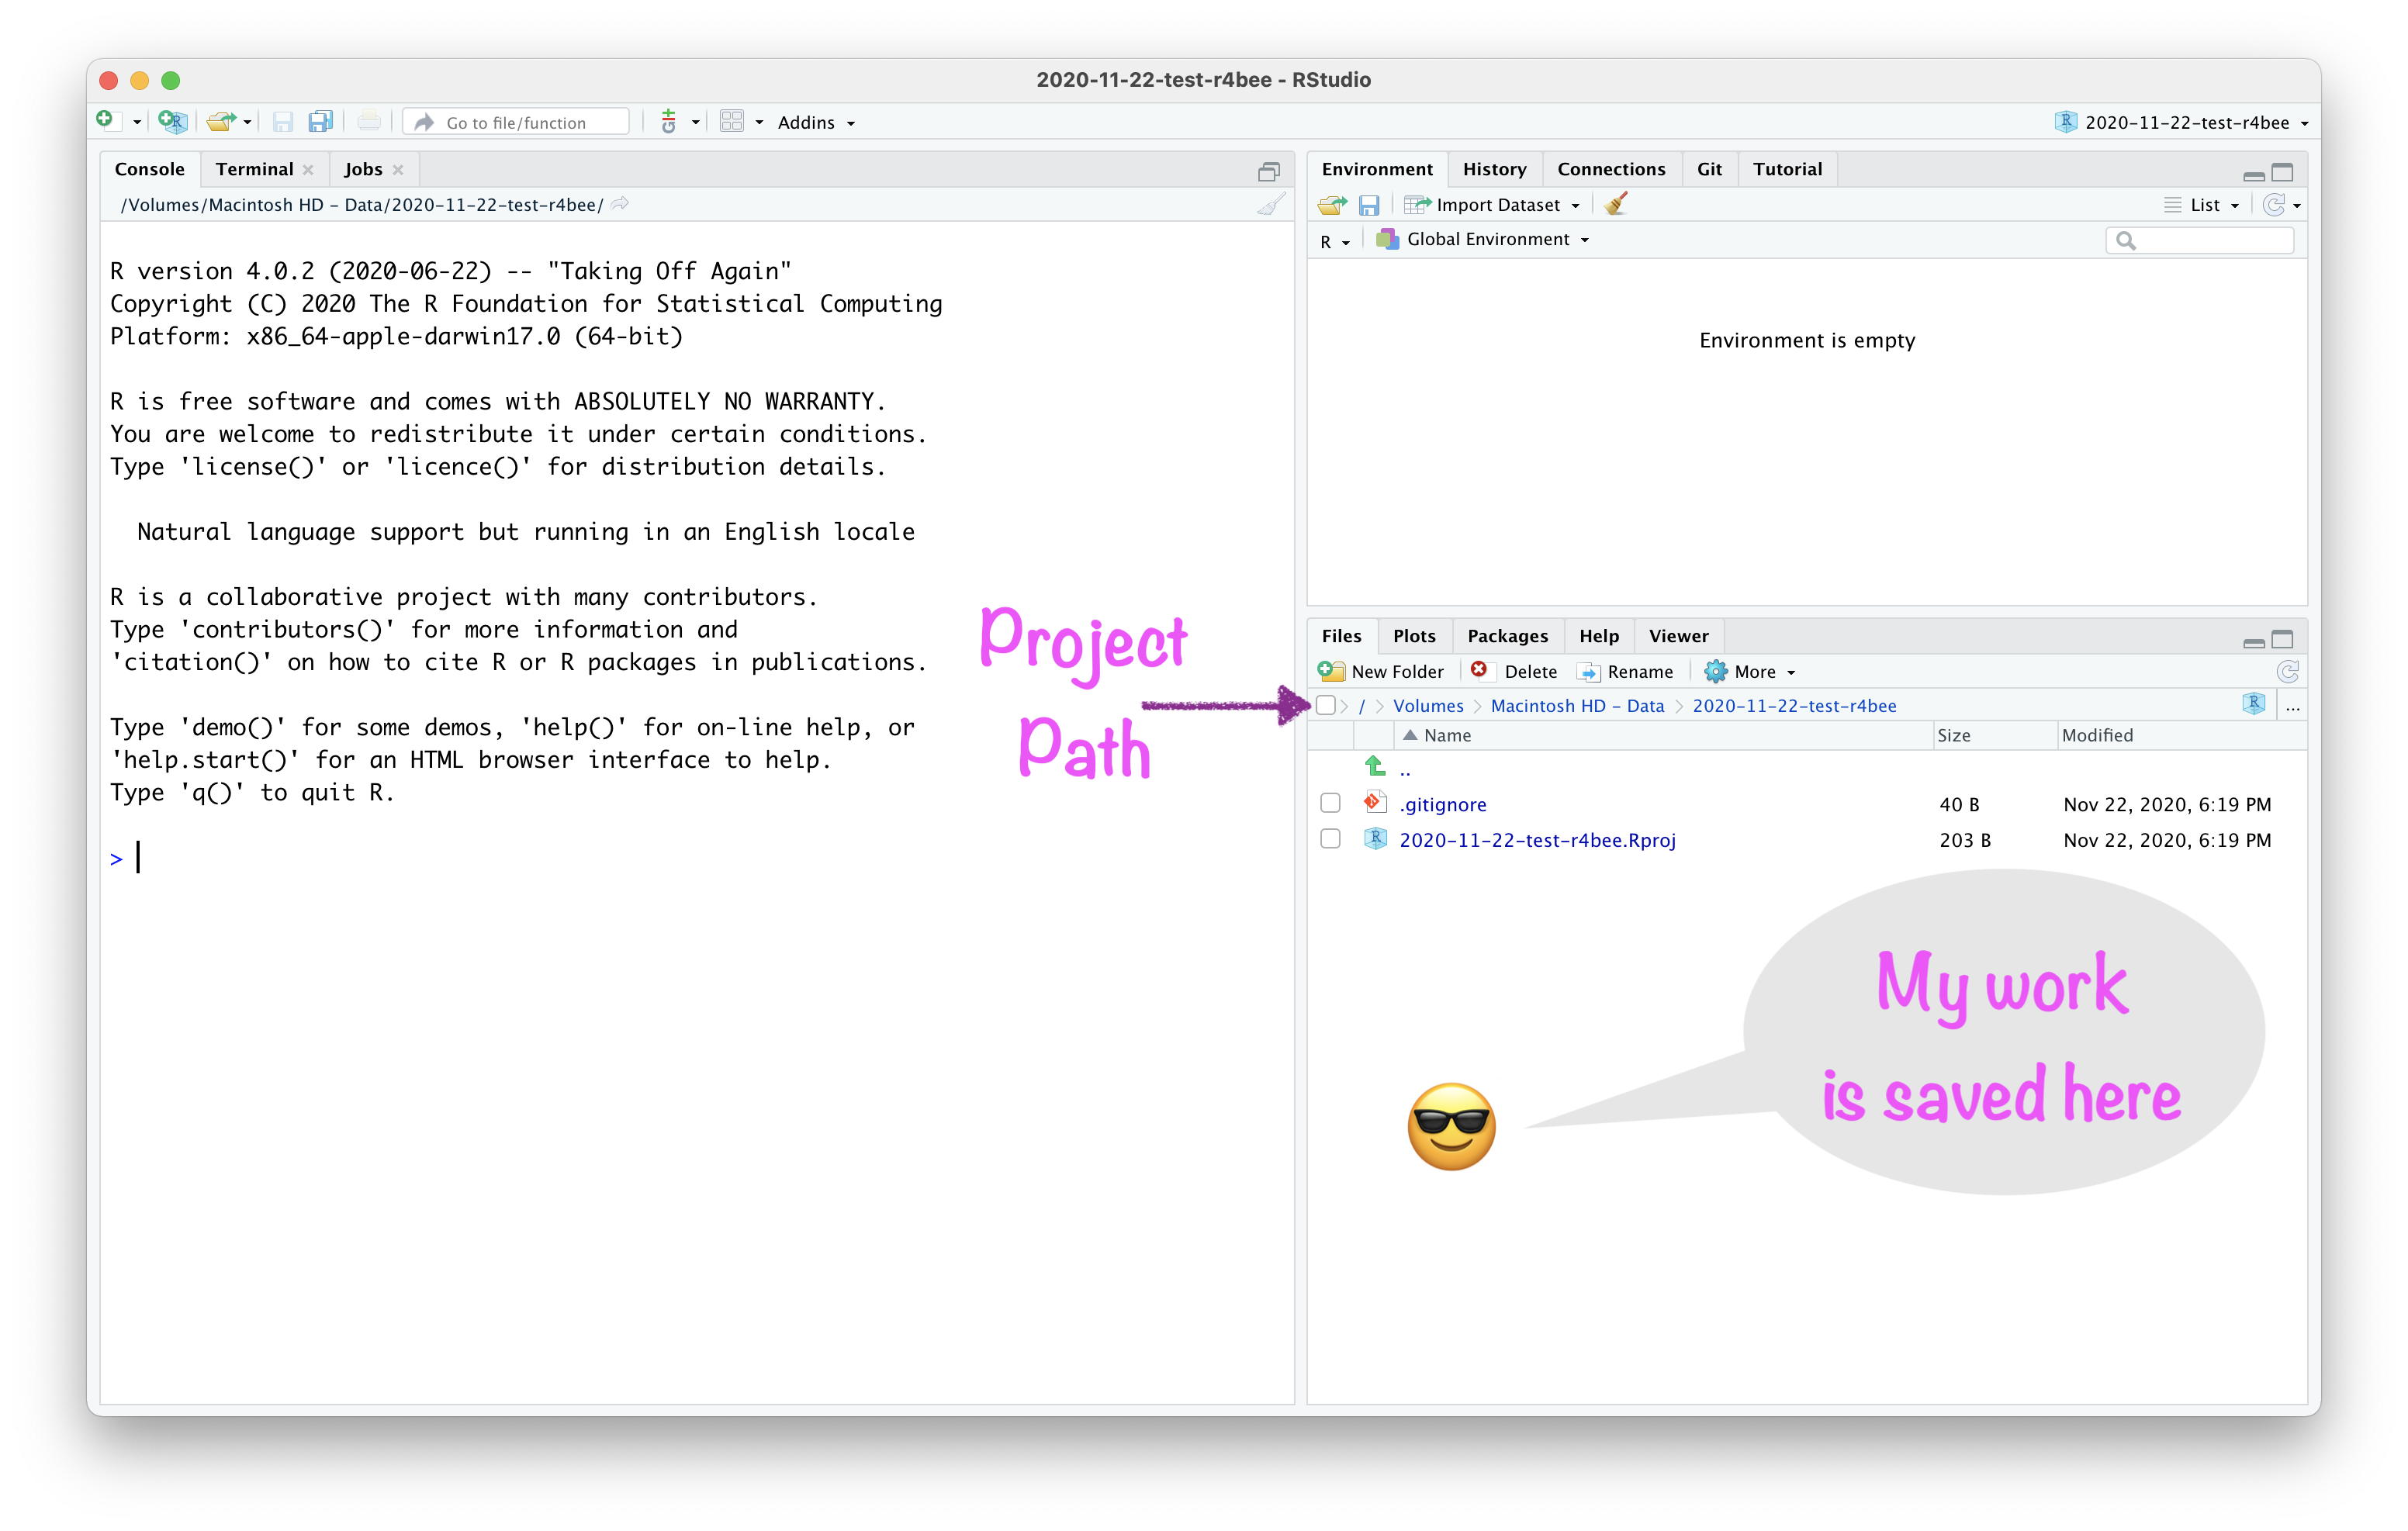
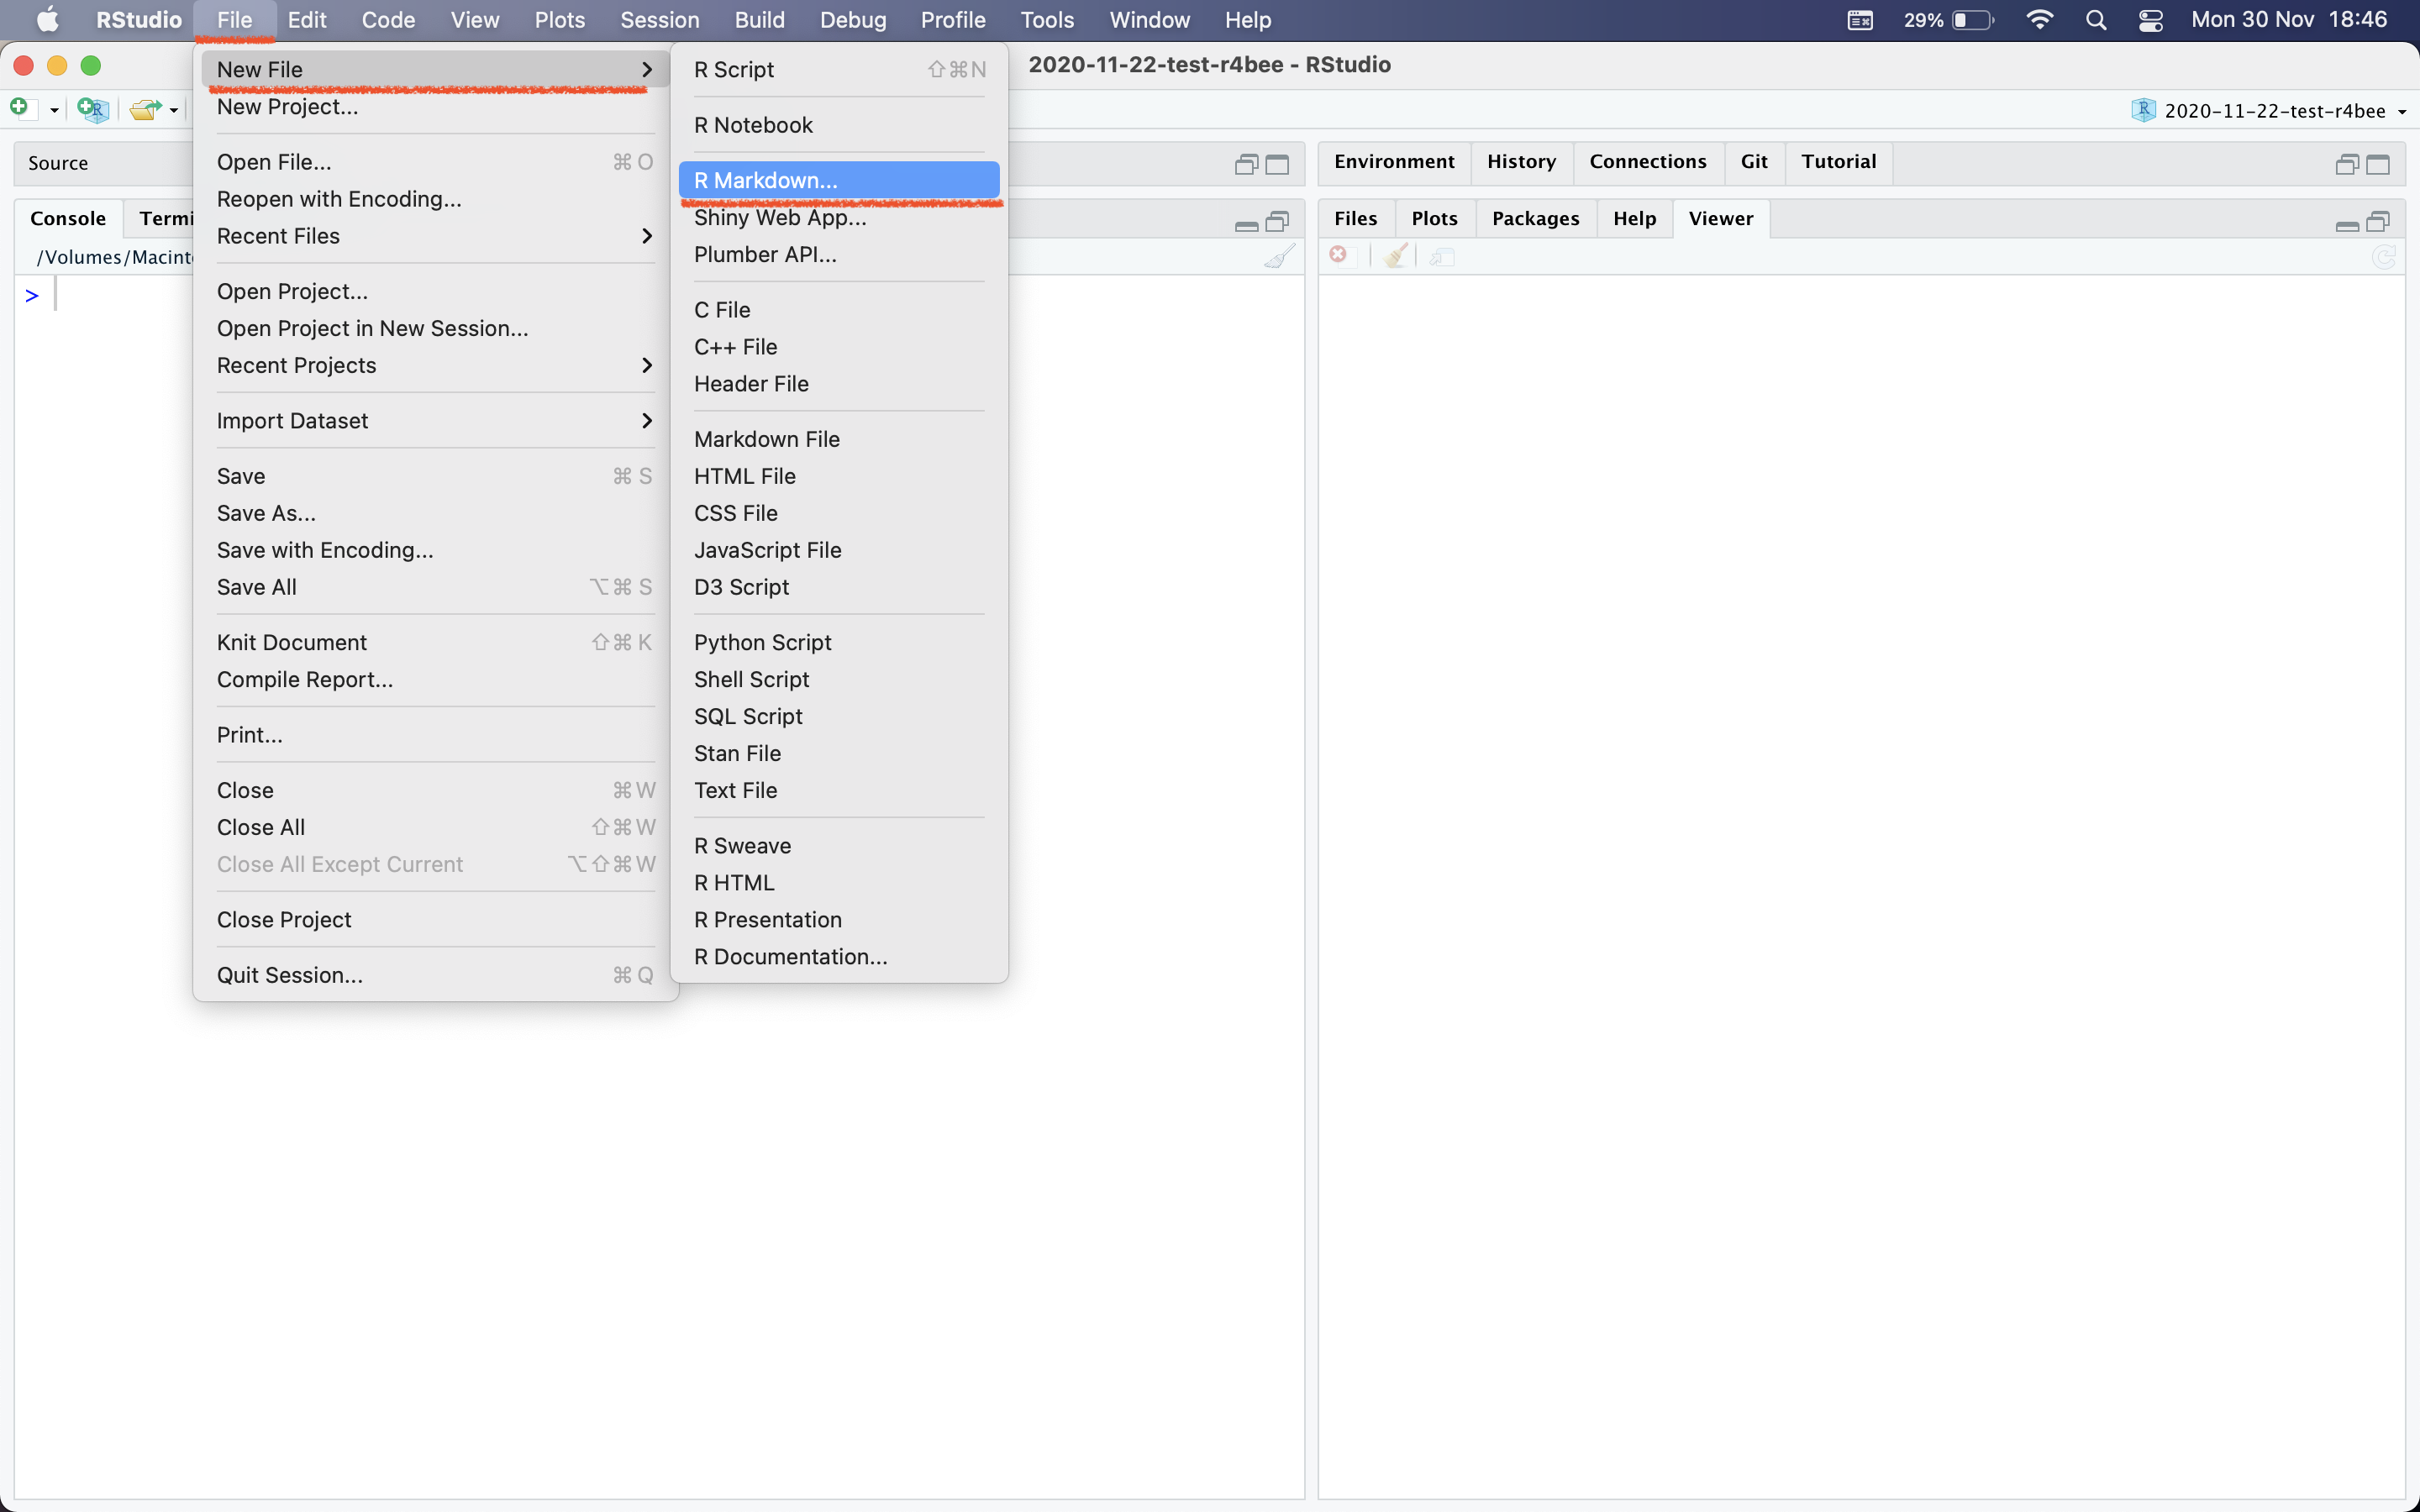
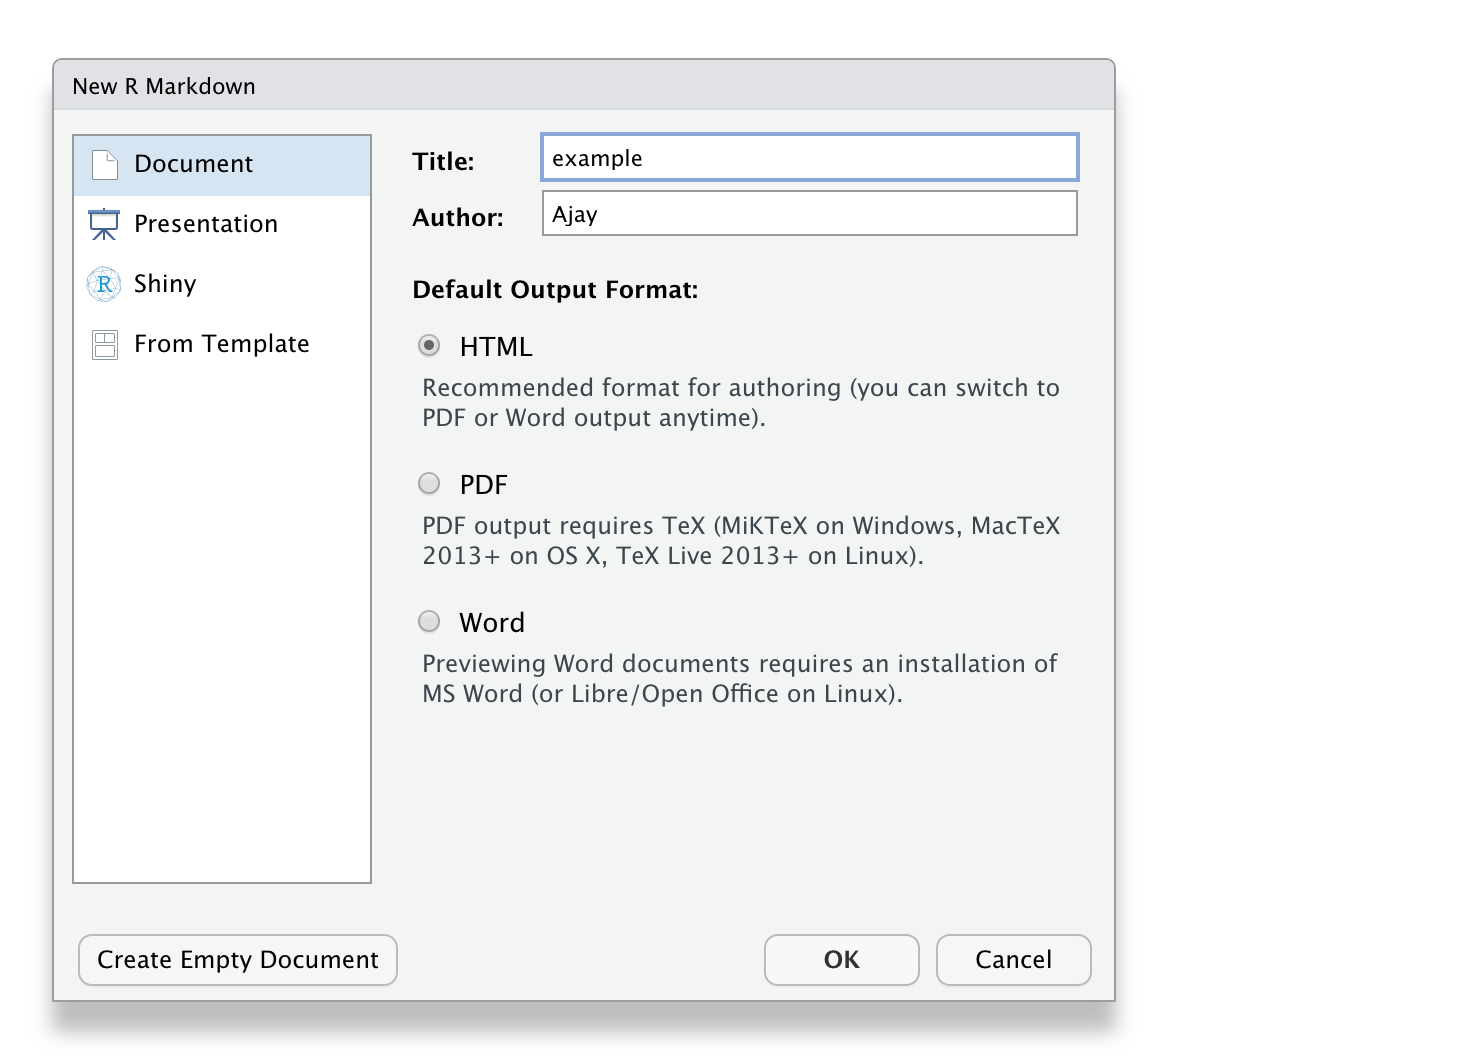
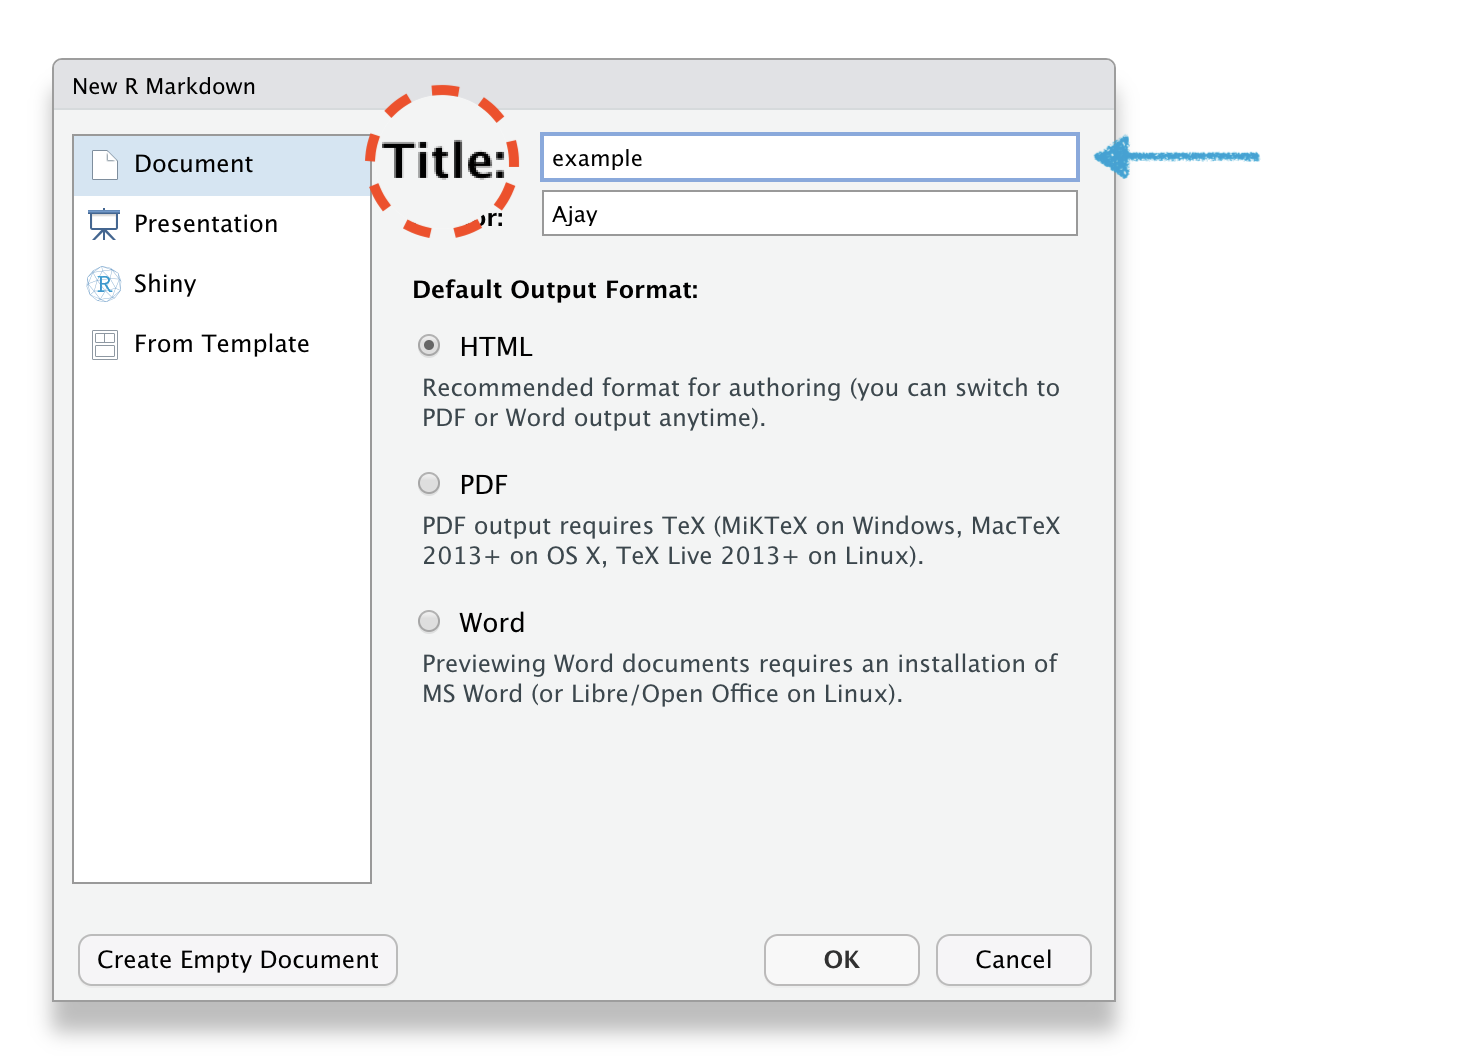
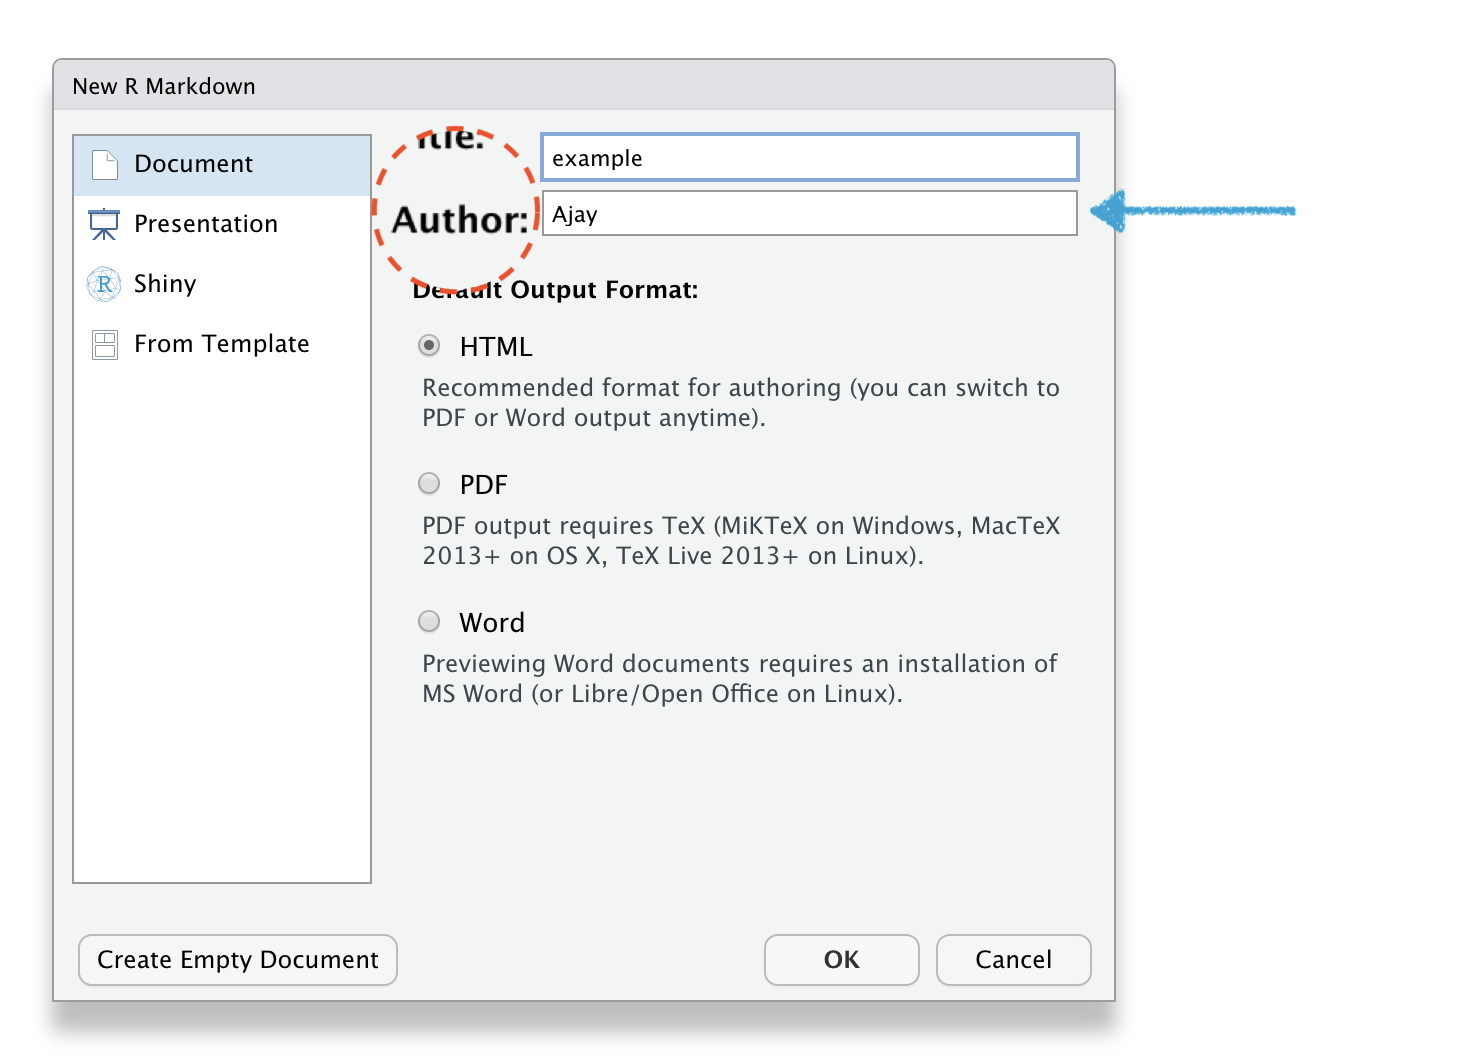
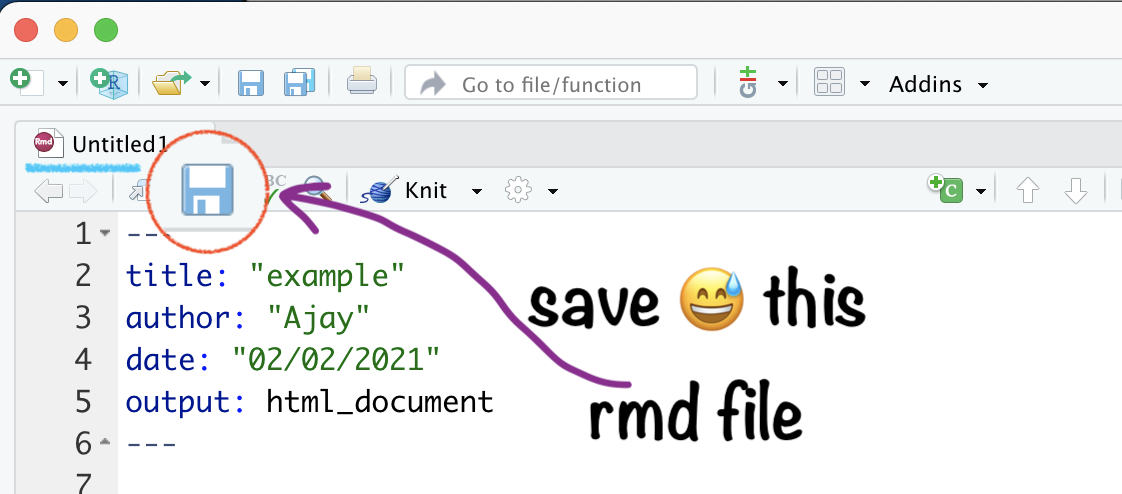
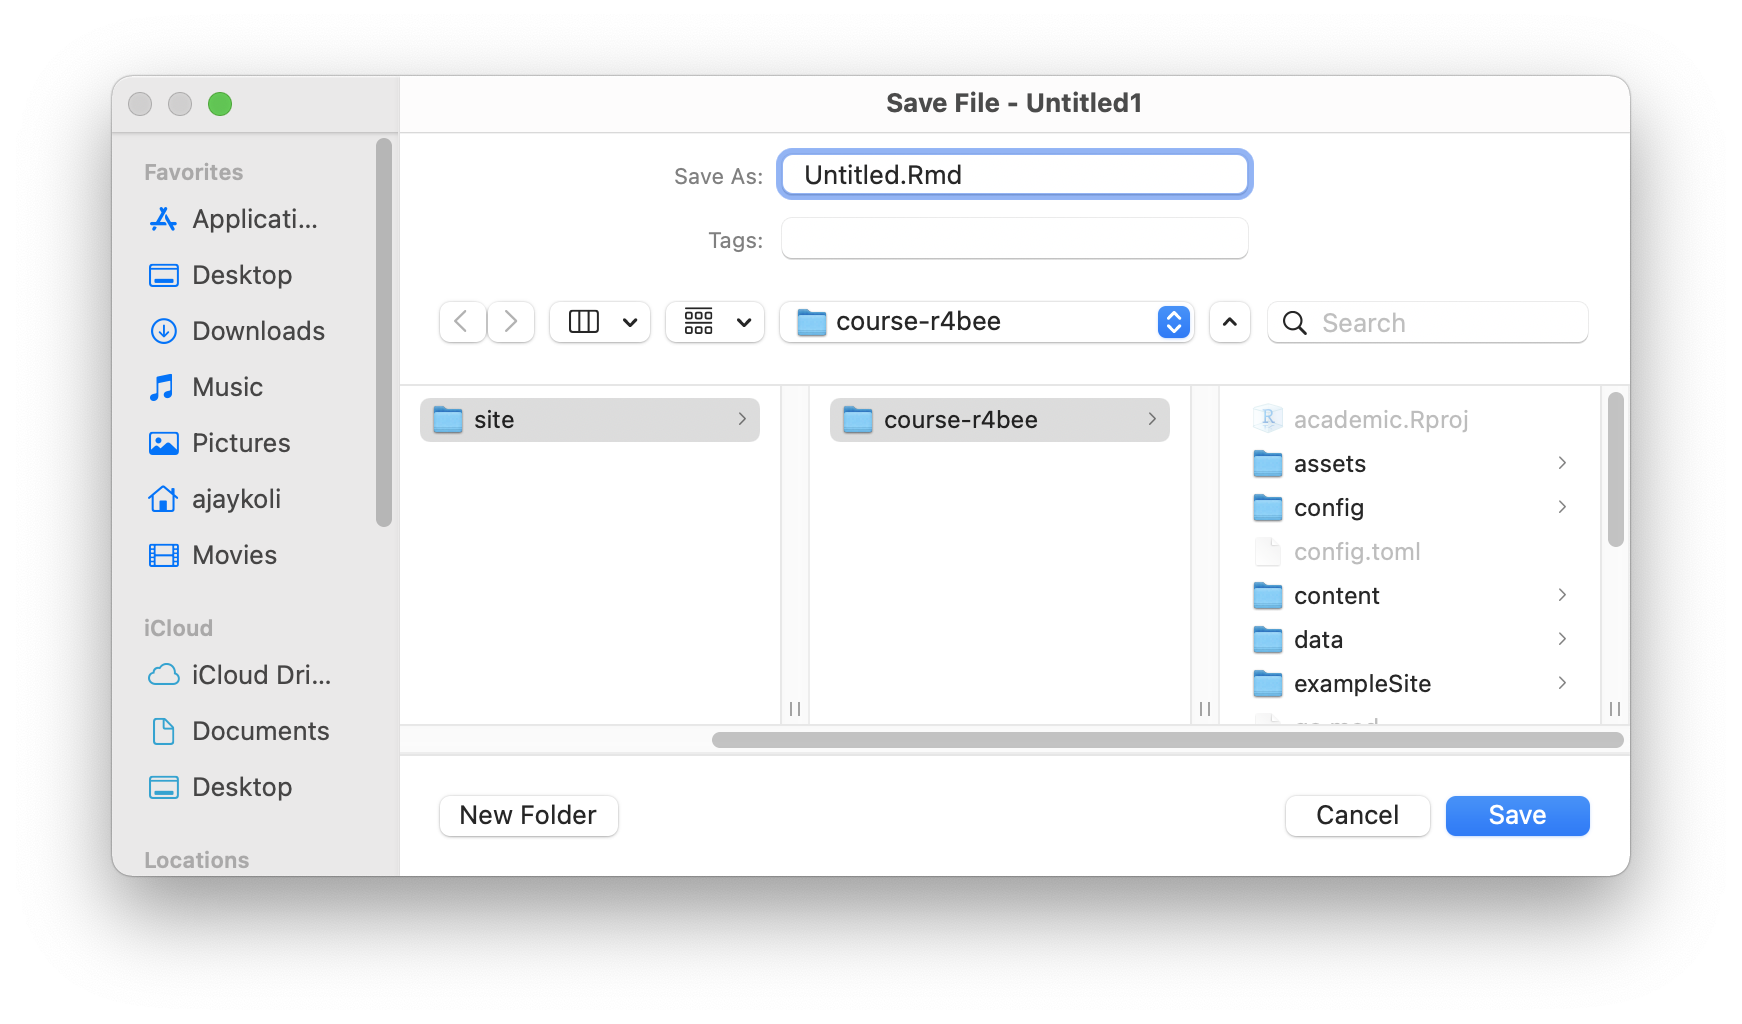
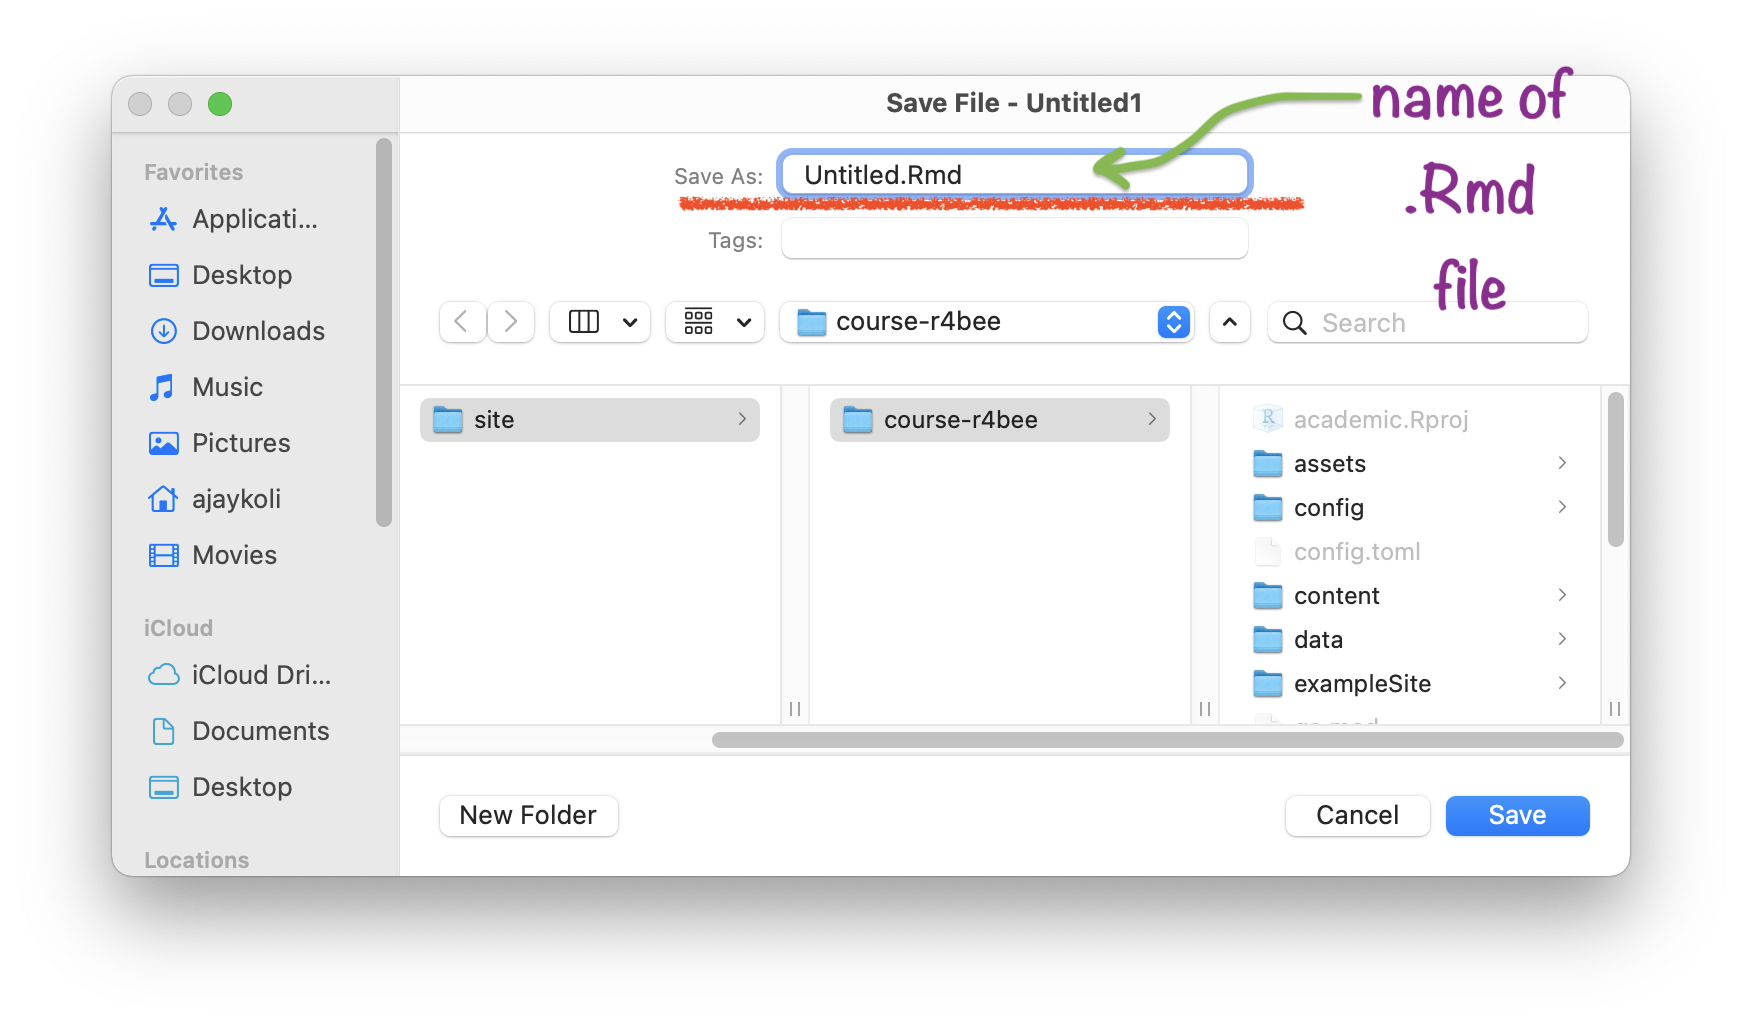
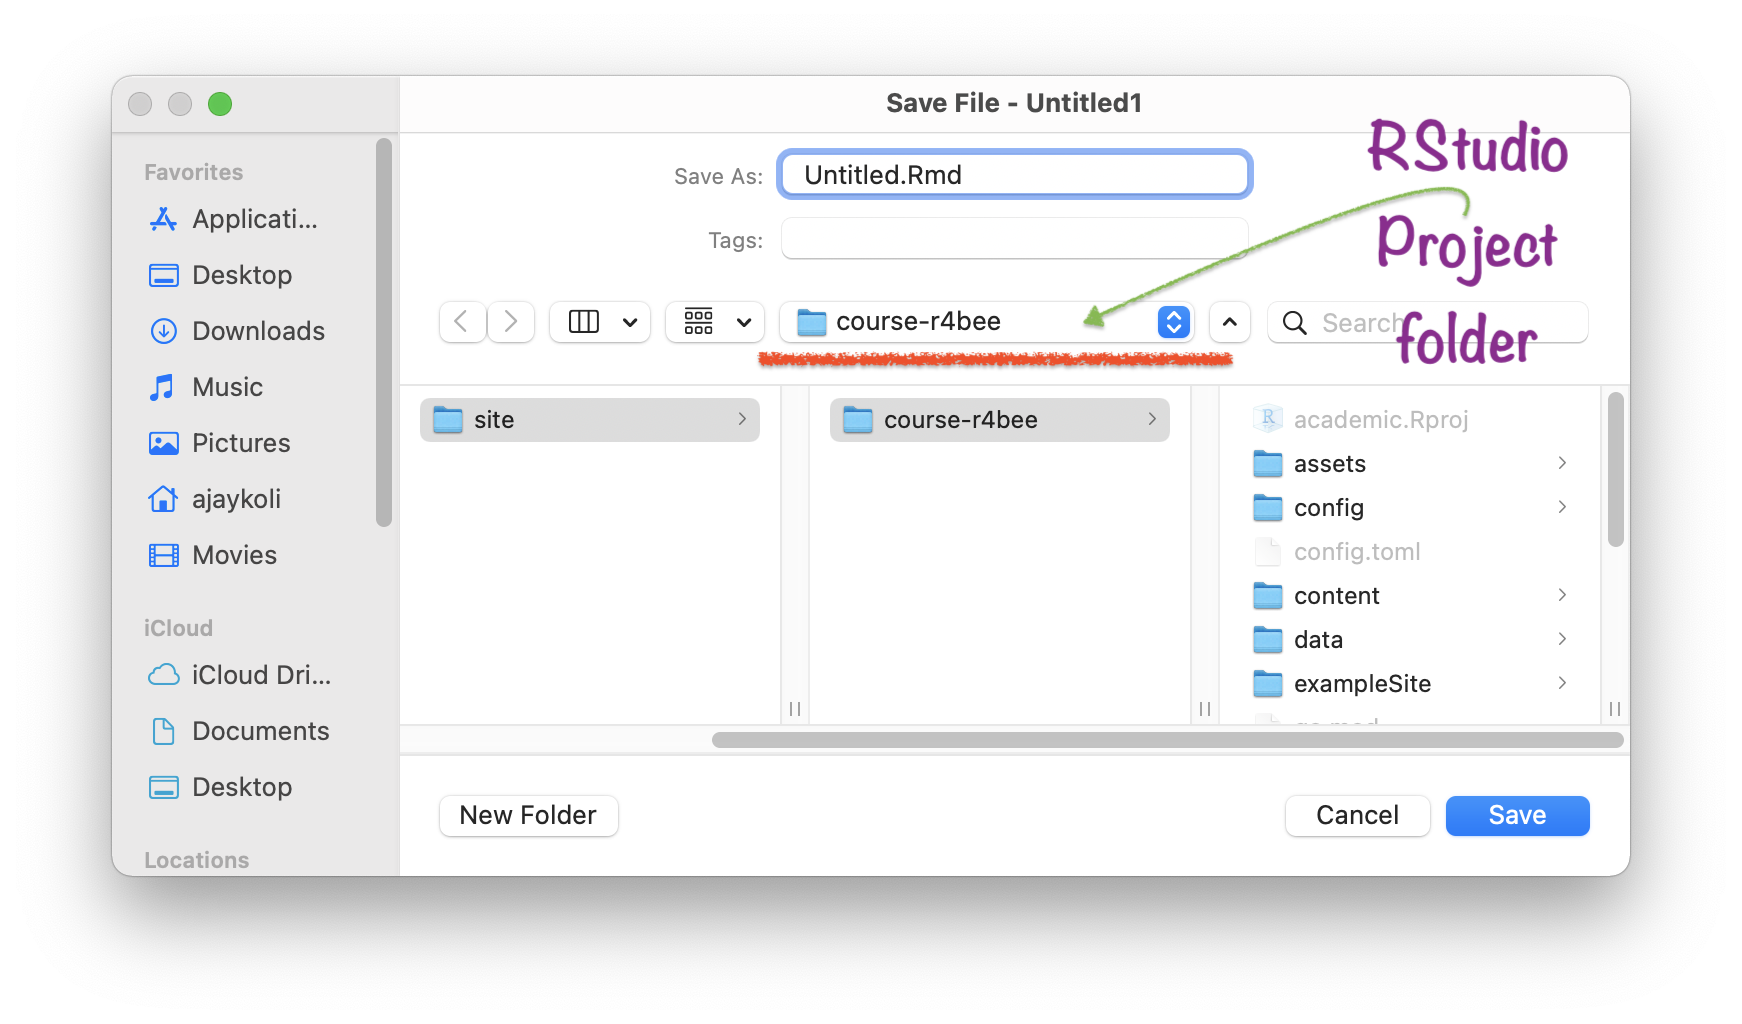
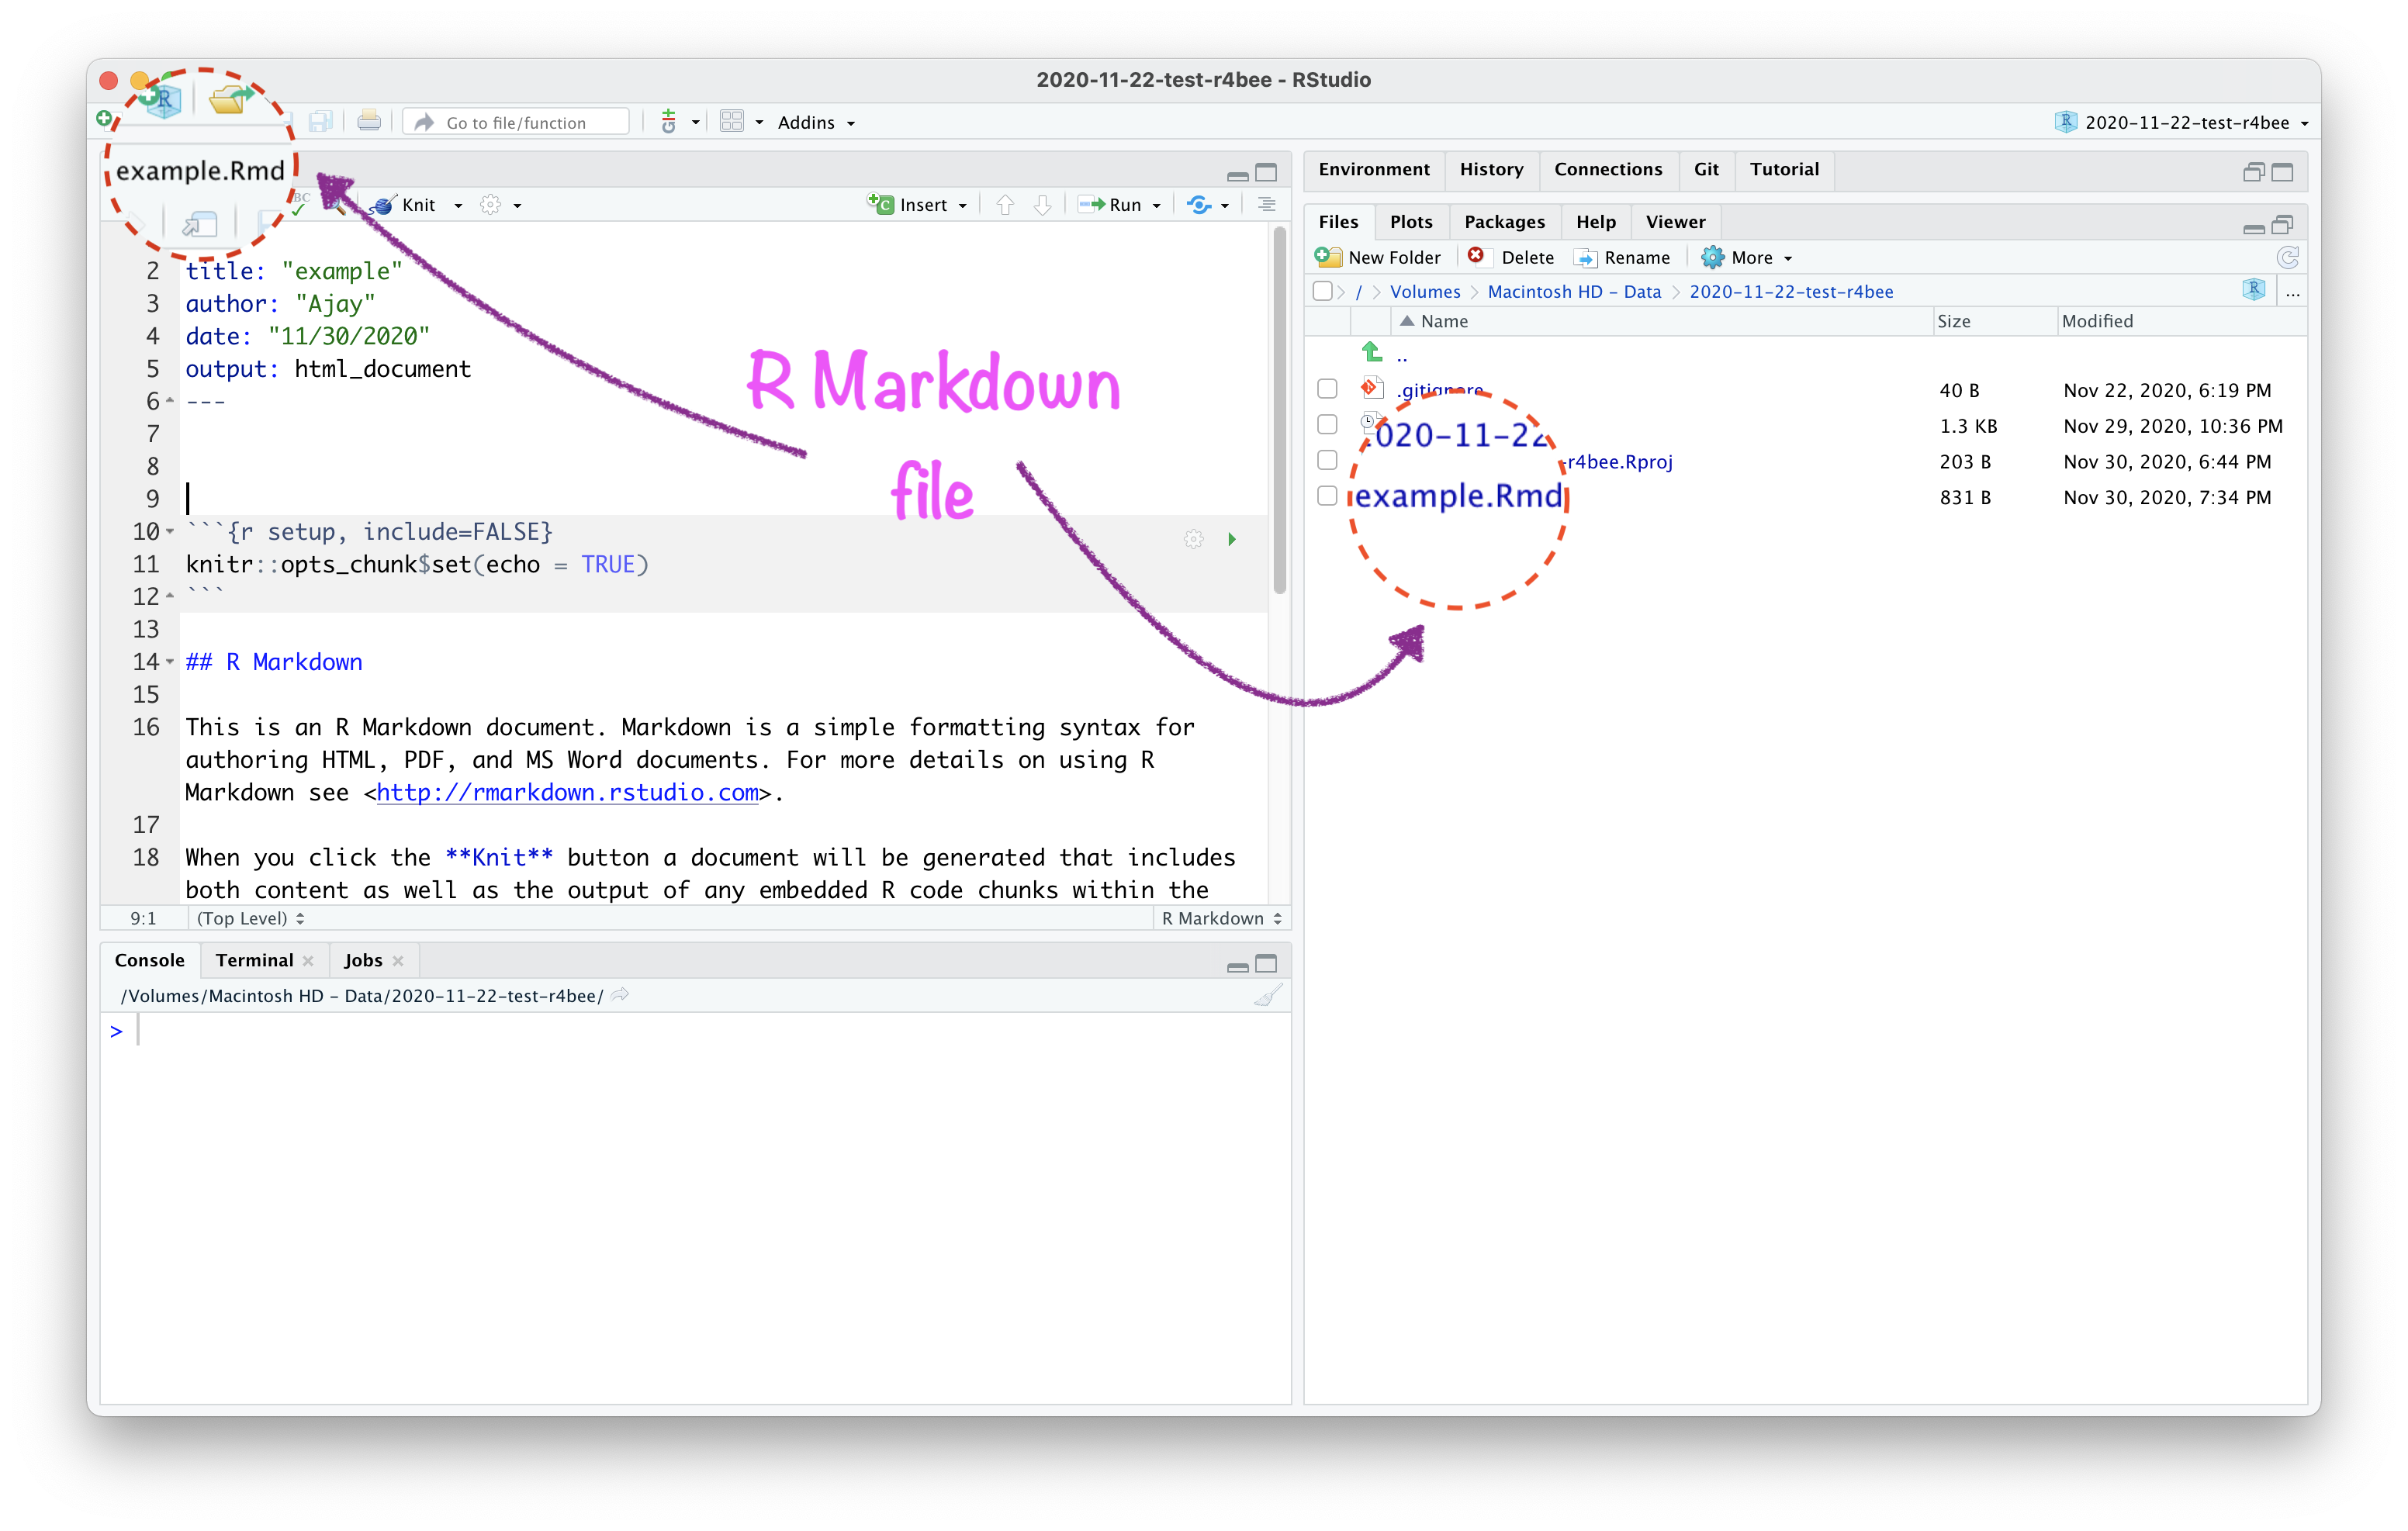
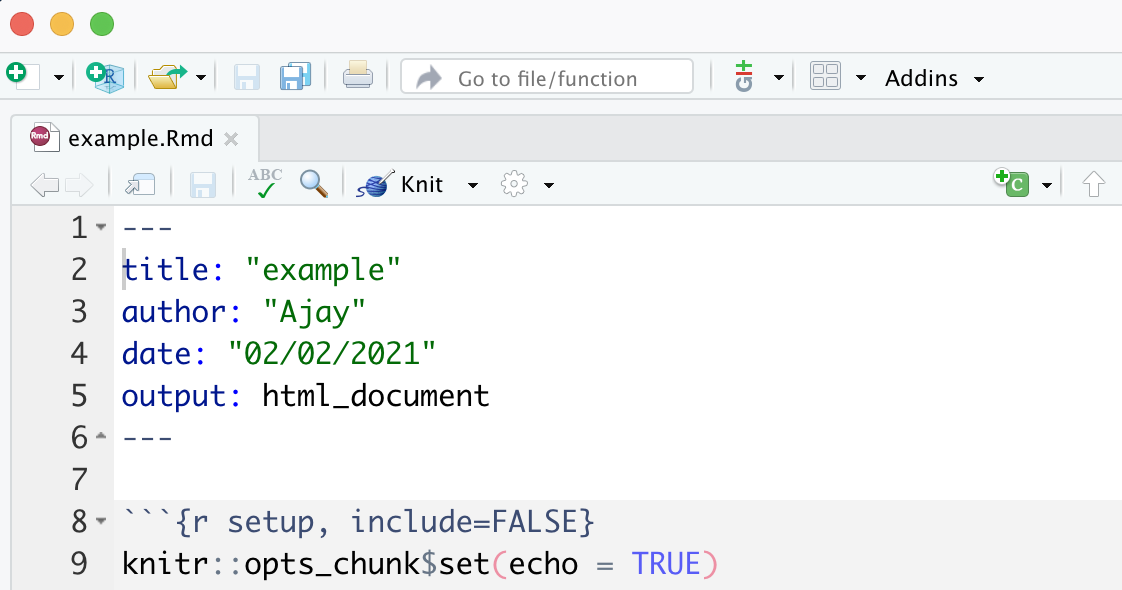
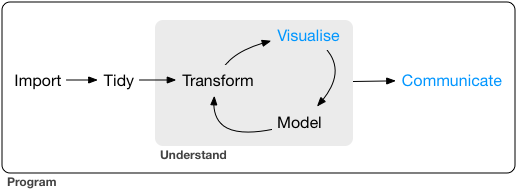
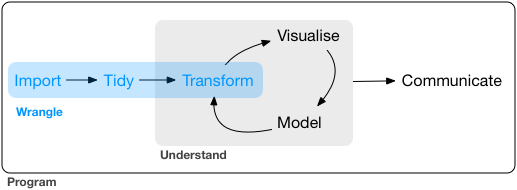
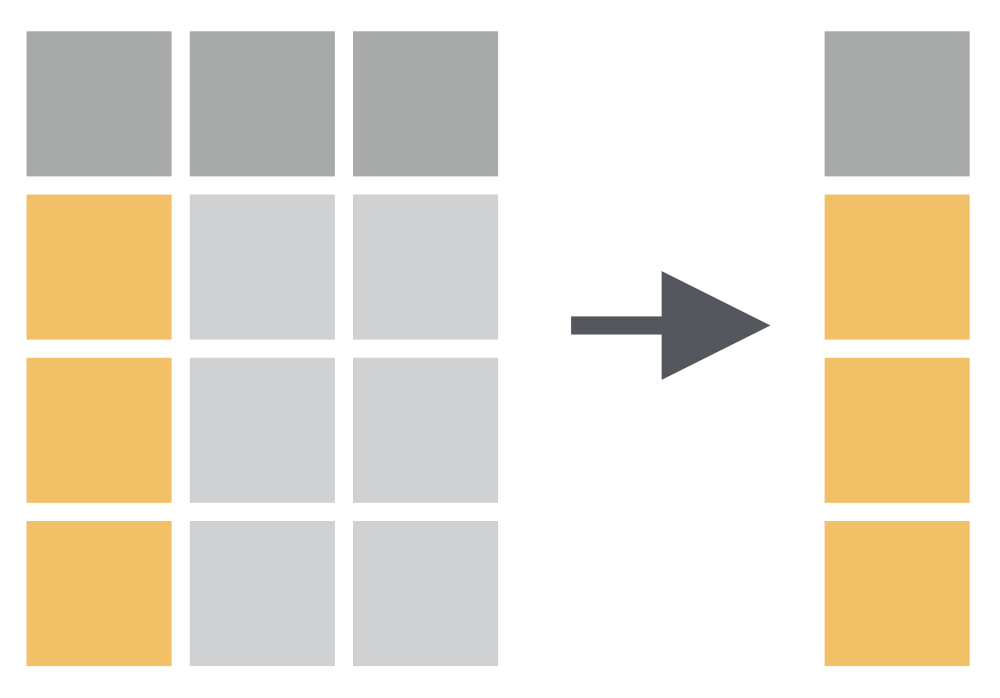
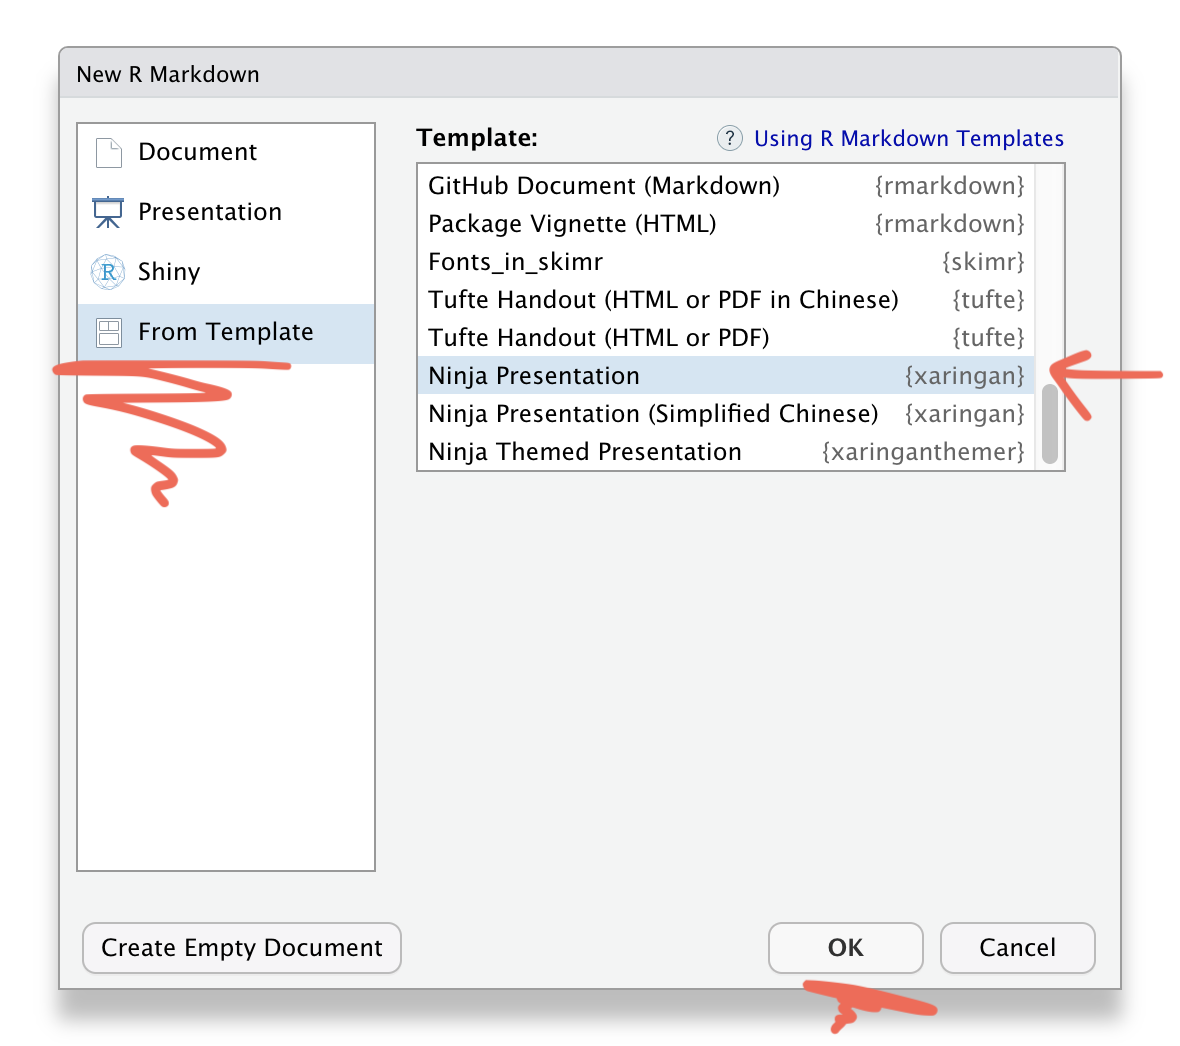
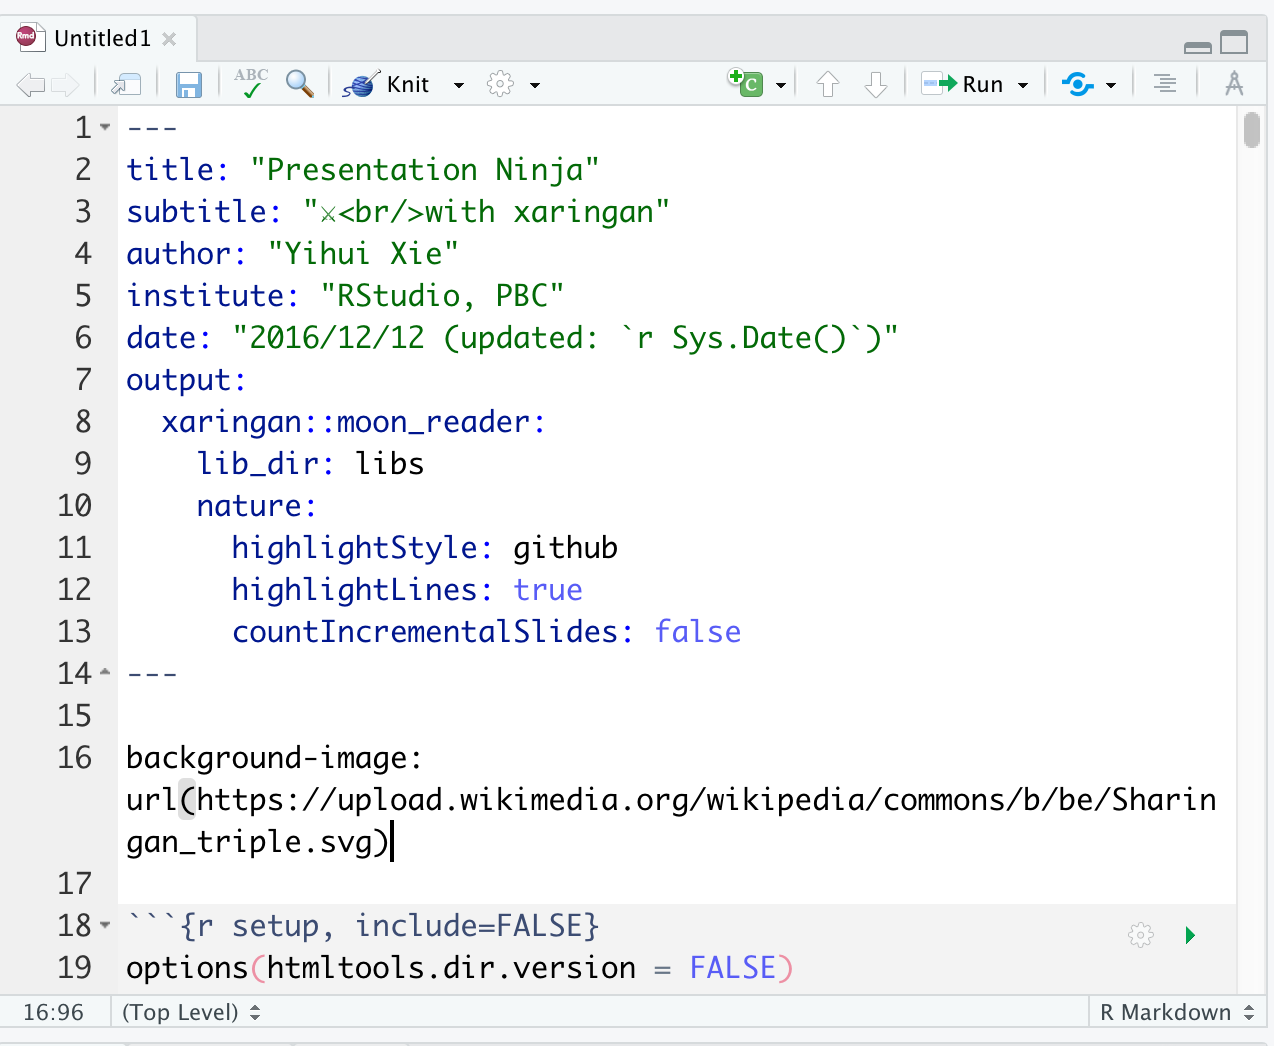
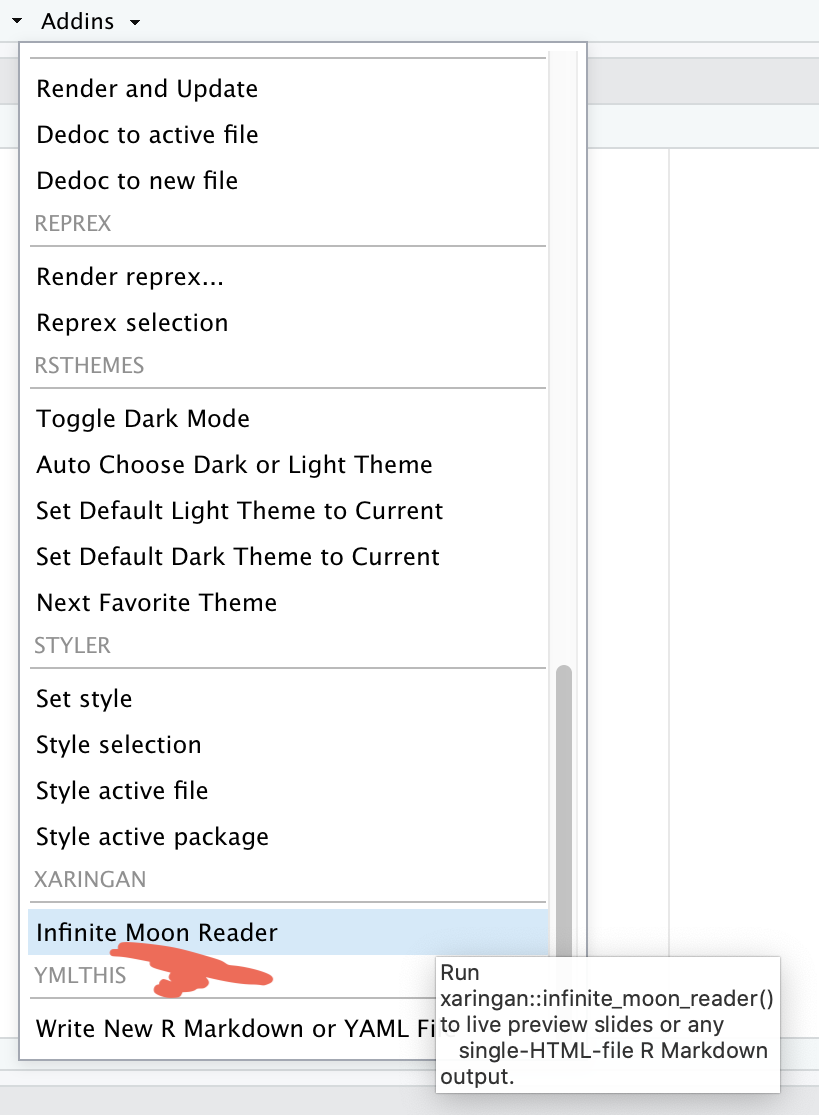
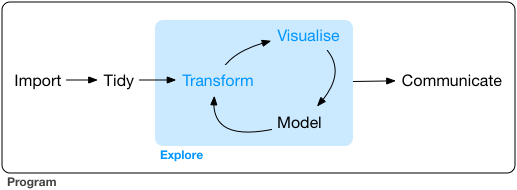
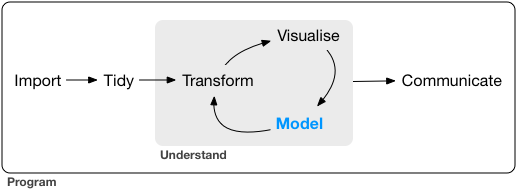
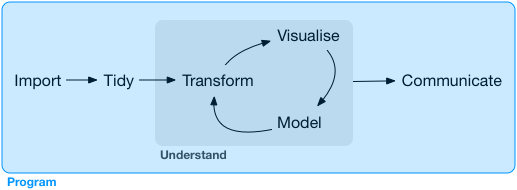
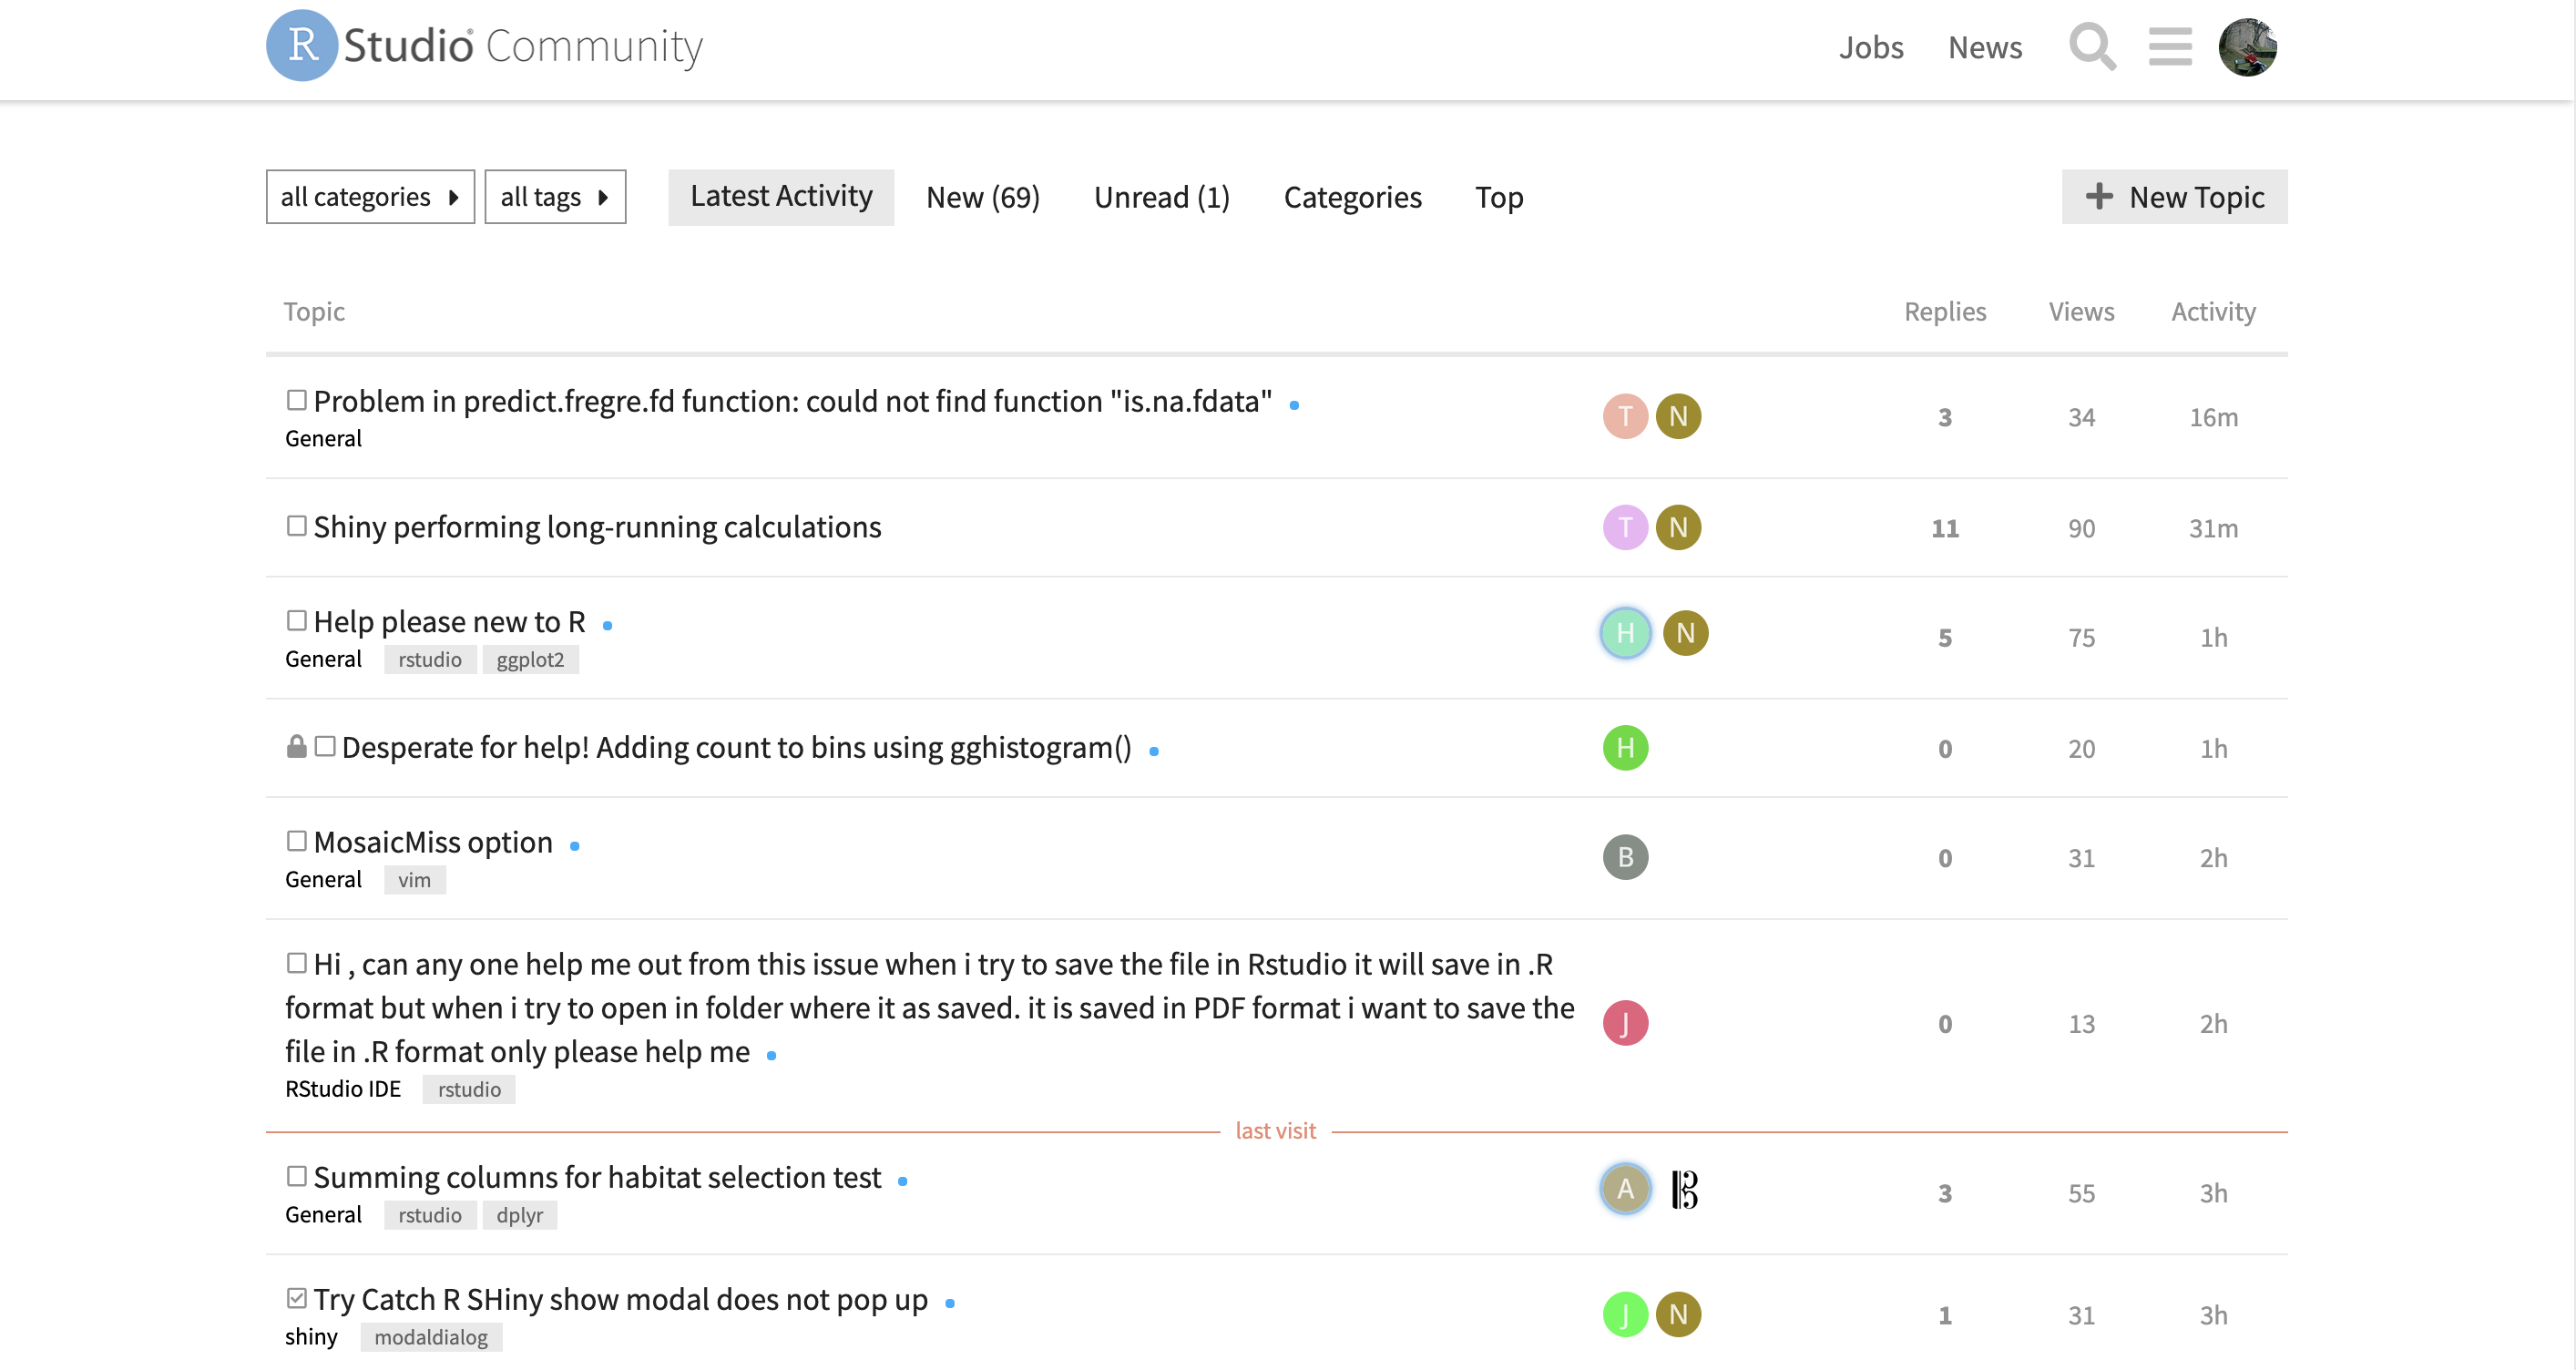
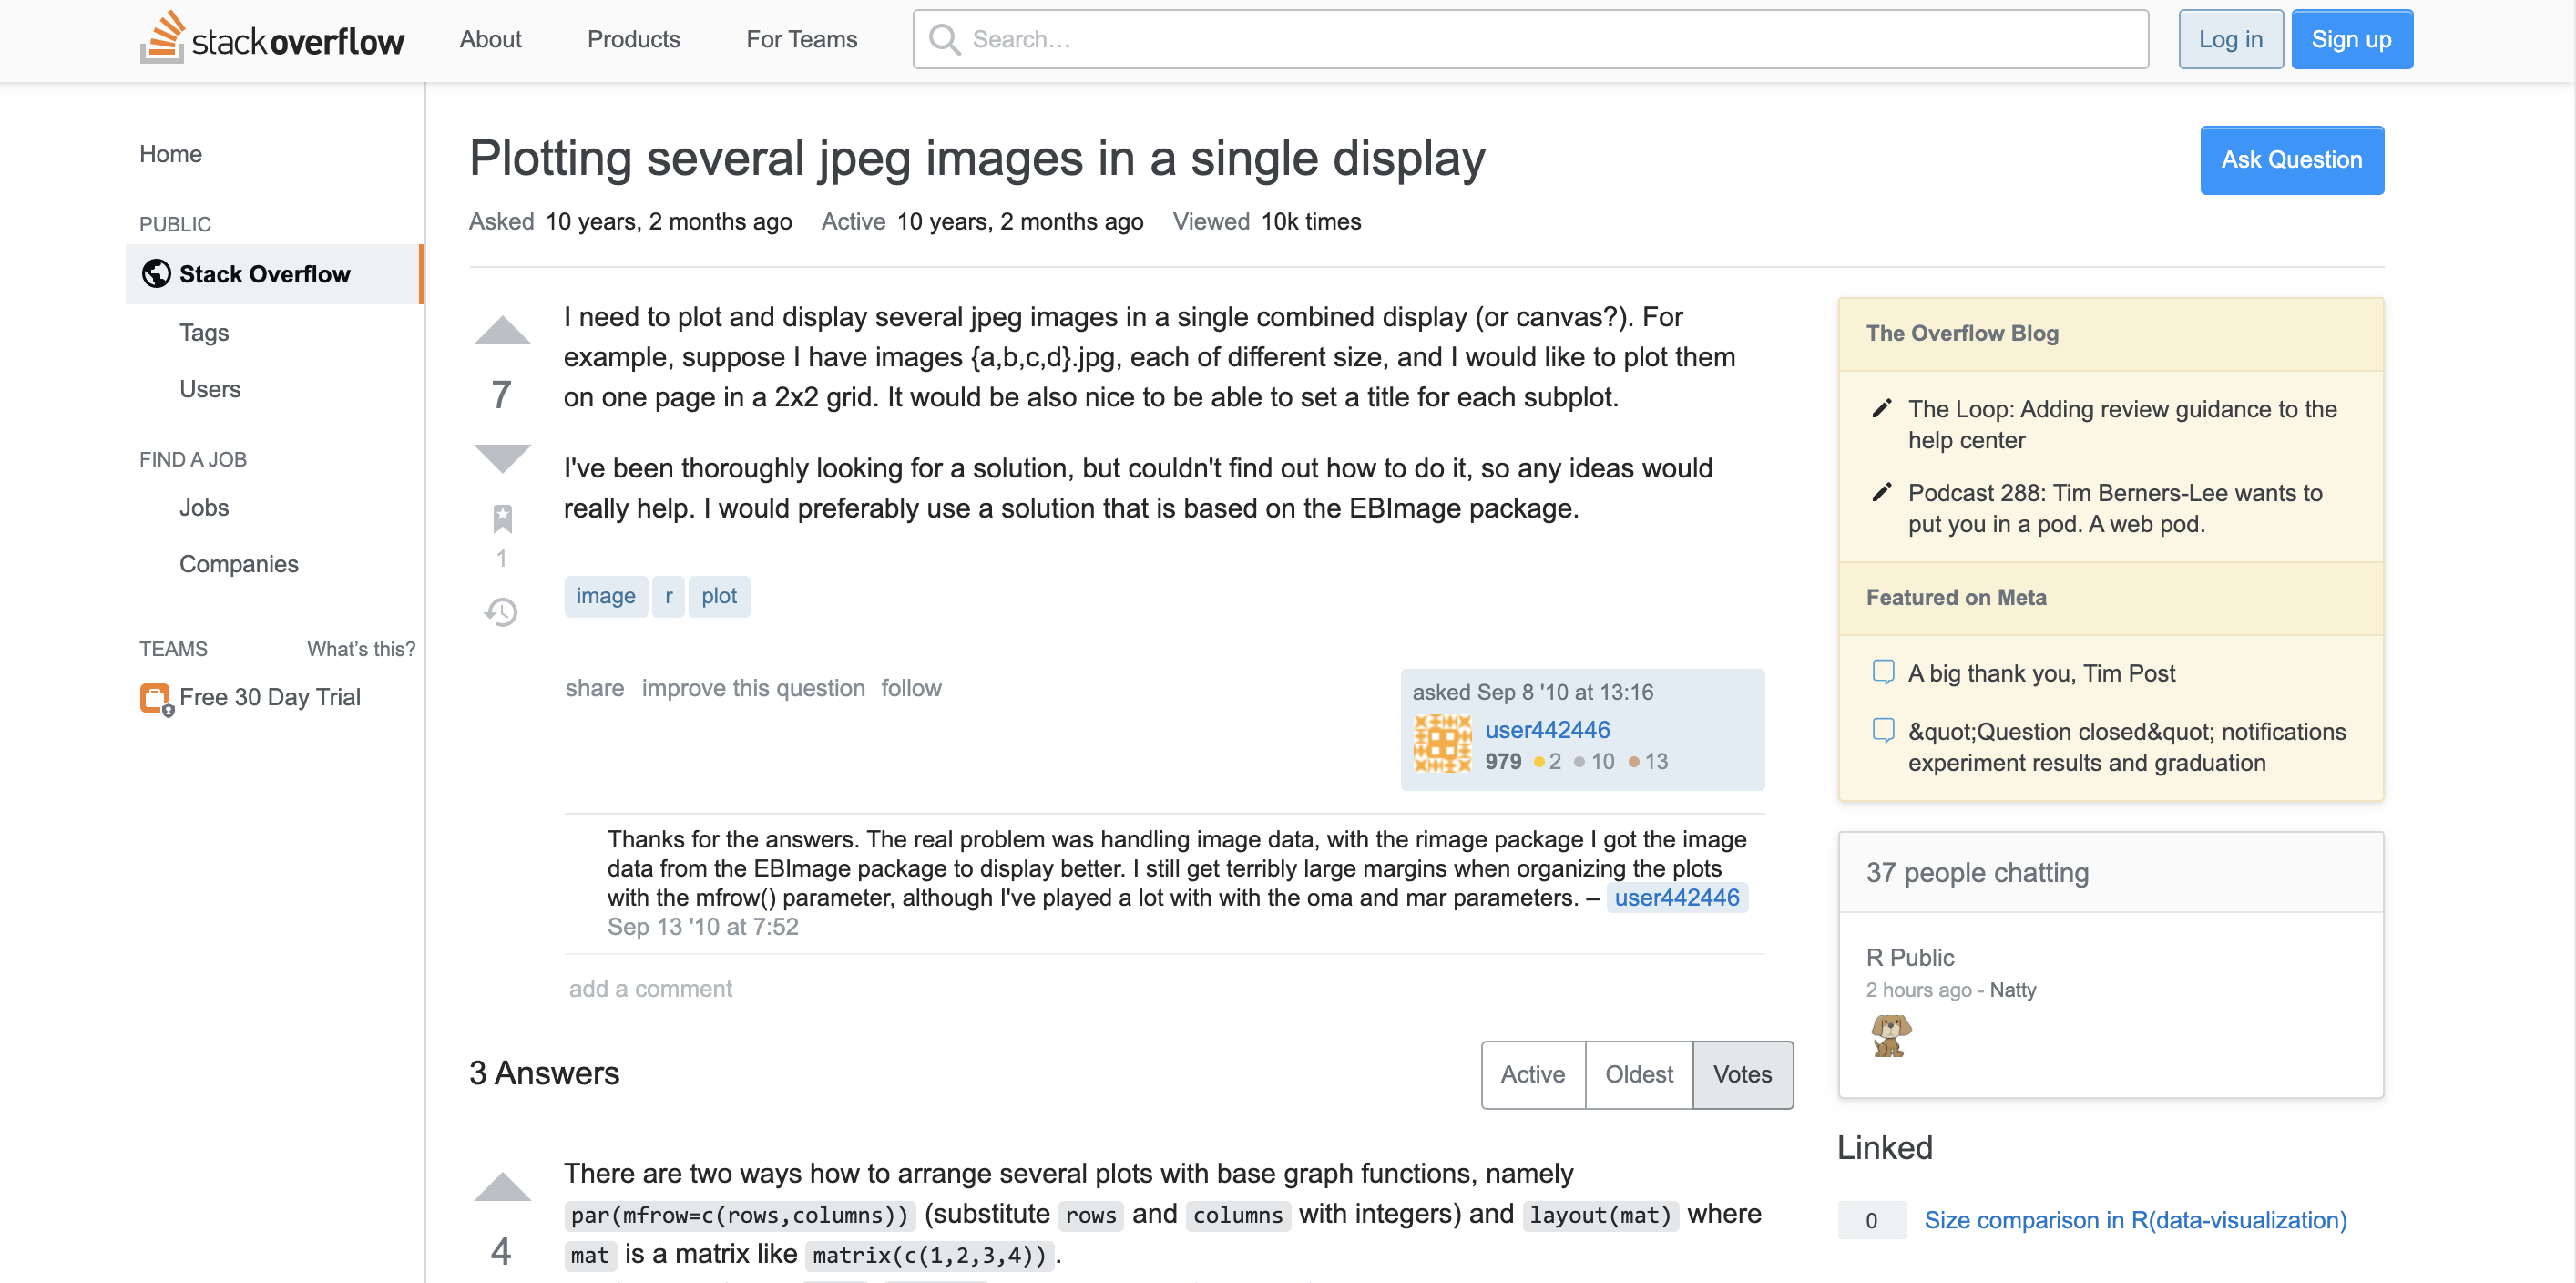
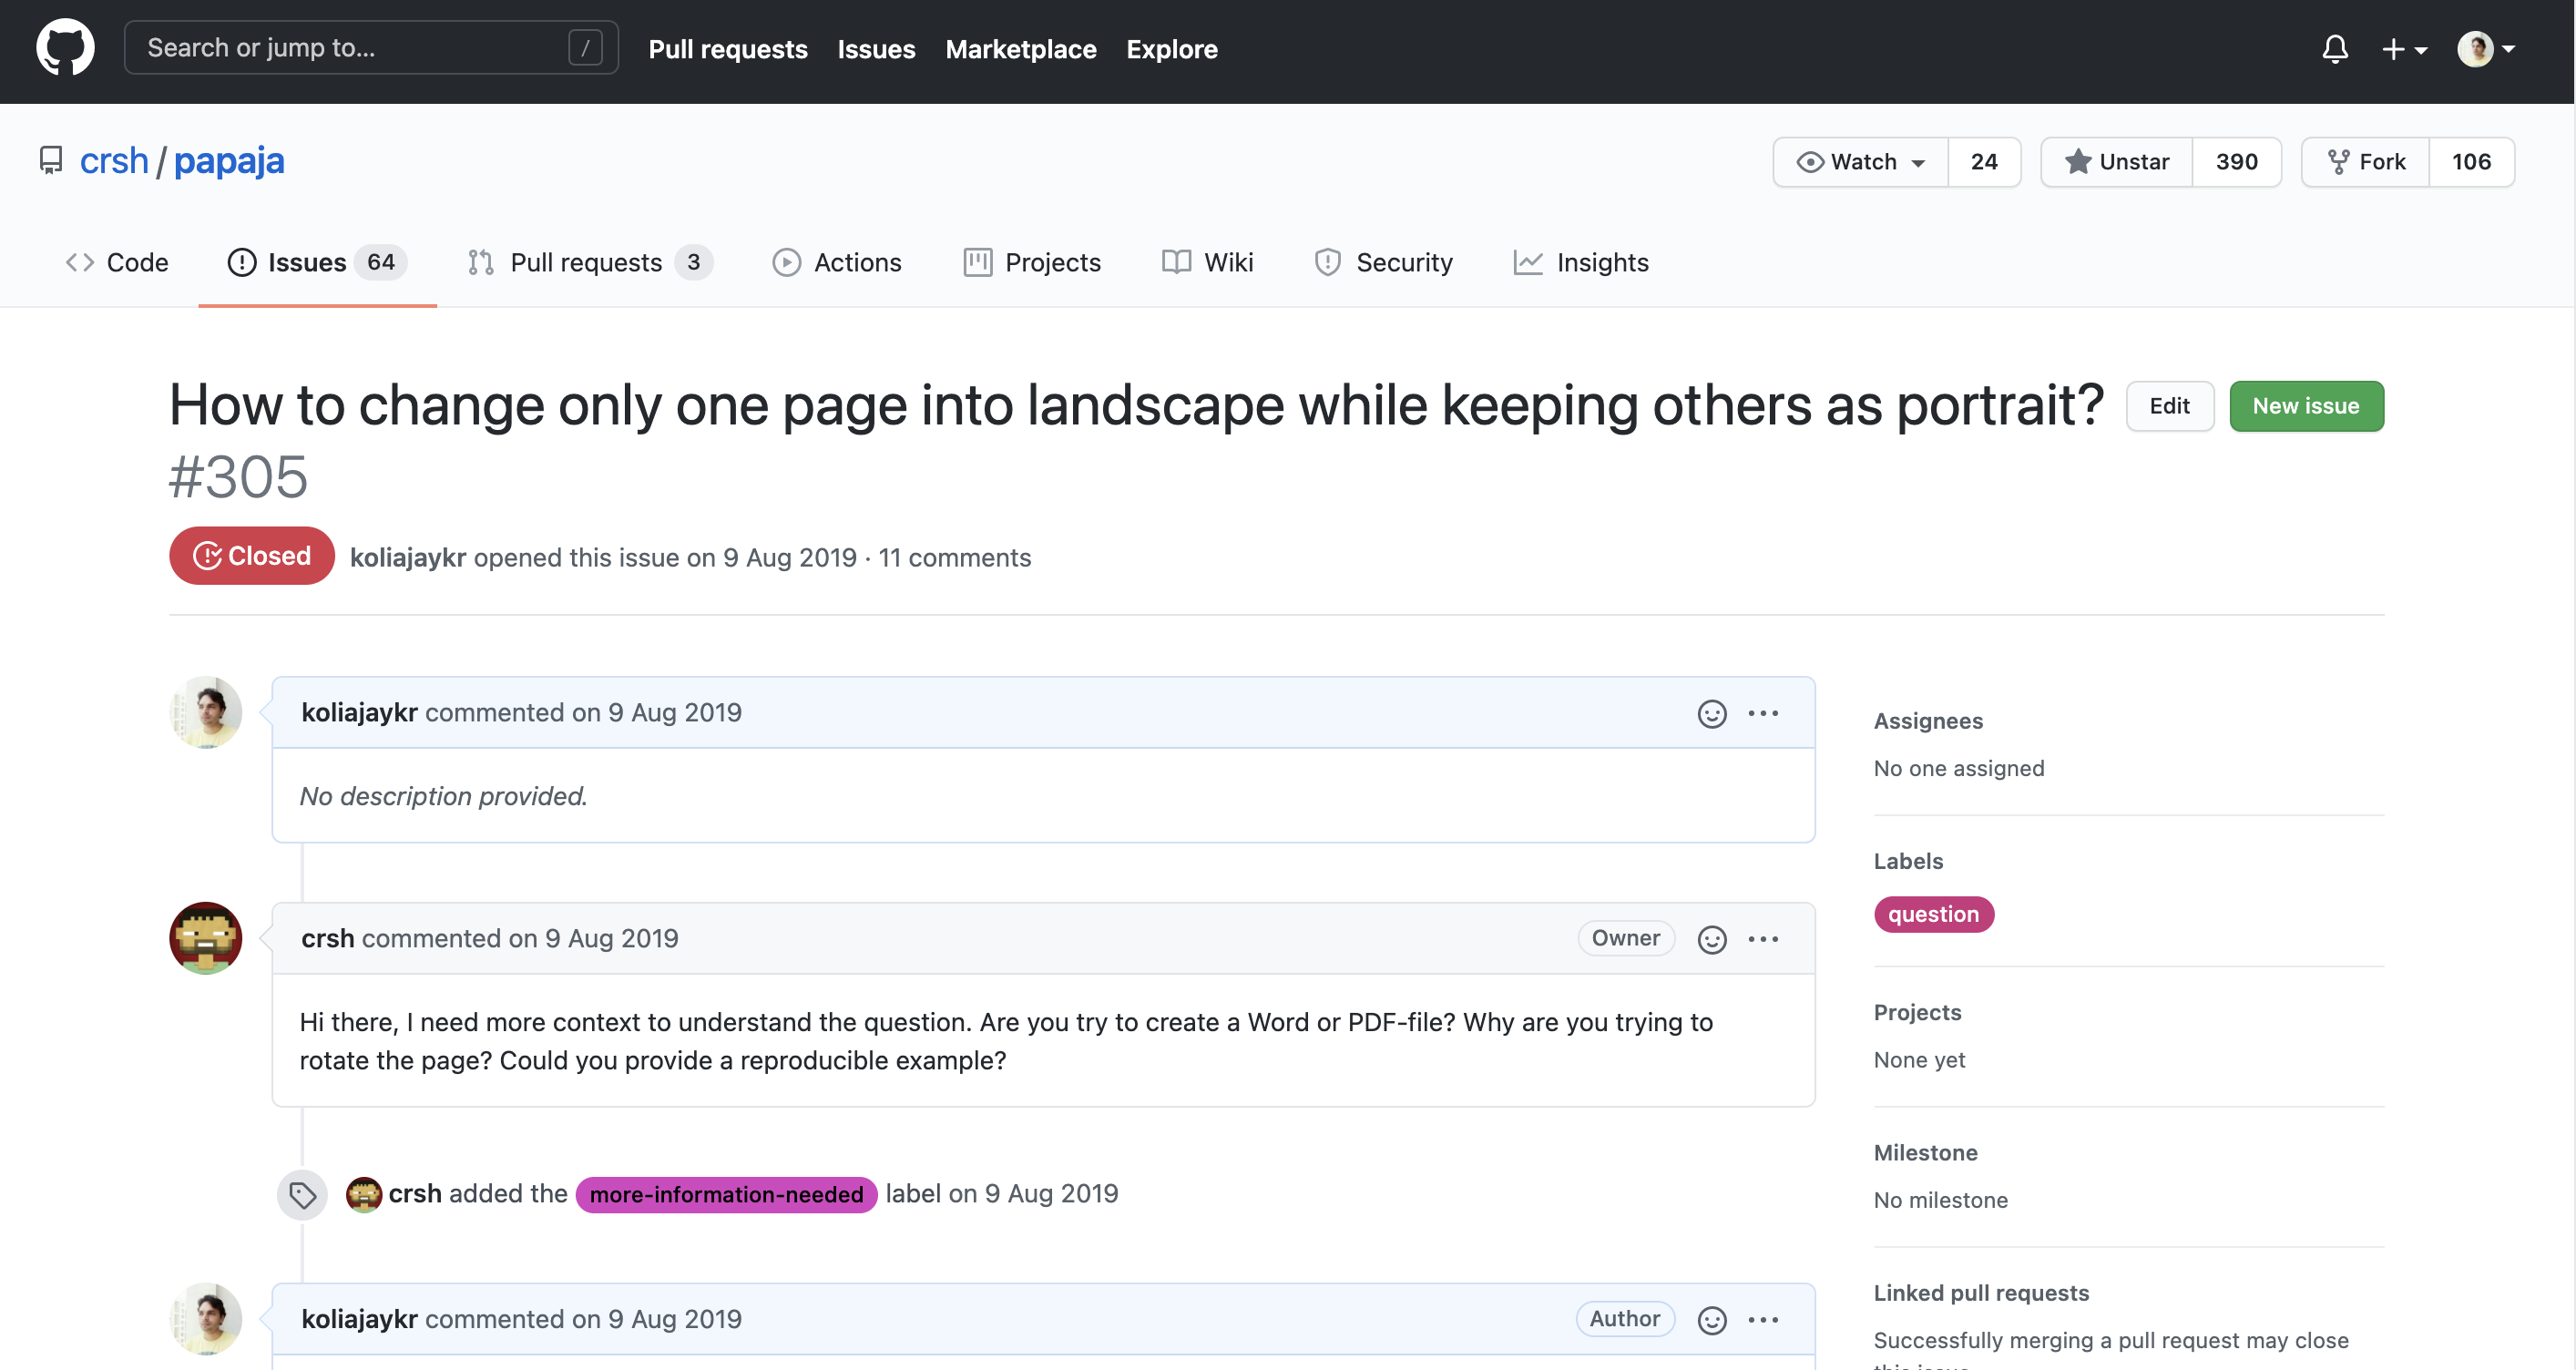
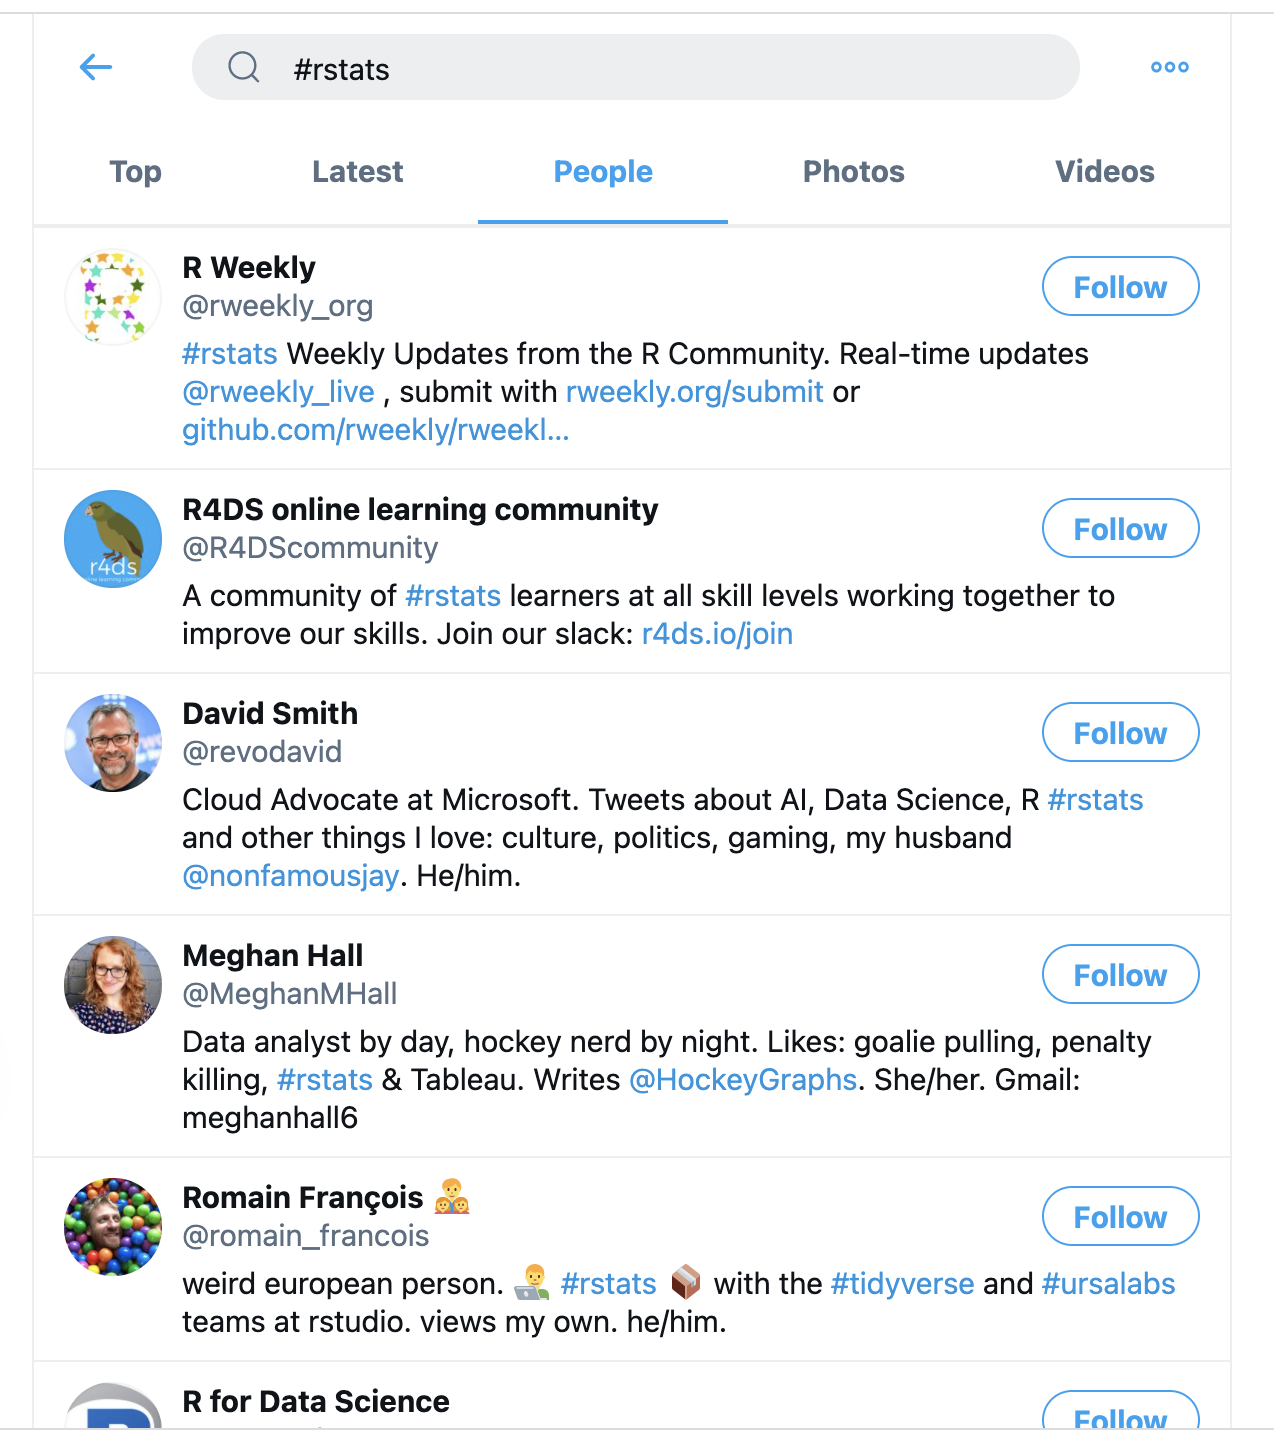
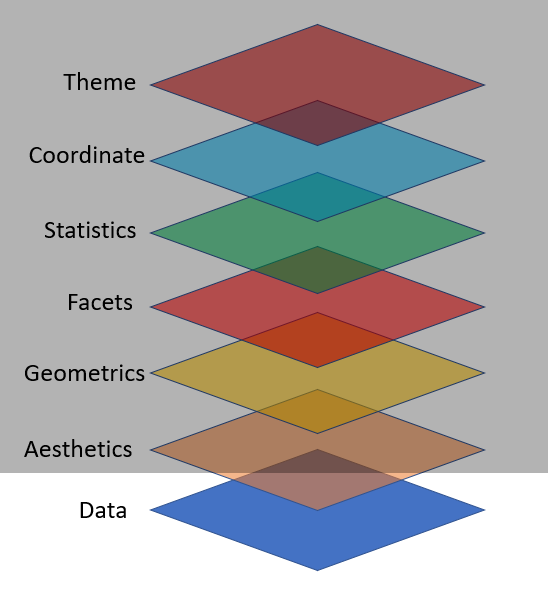
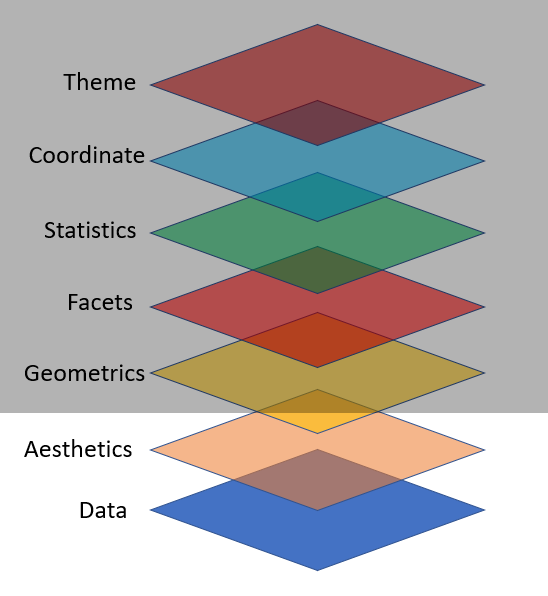
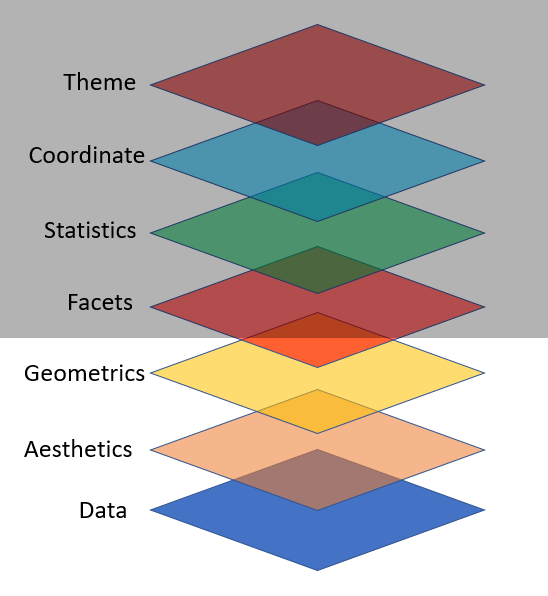
class: title-slide, center, middle, hide-count, hide-logo background-image: url("https://images.unsplash.com/photo-1513890333407-6f85205e8ef2?ixlib=rb-1.2.1&ixid=MnwxMjA3fDB8MHxwaG90by1wYWdlfHx8fGVufDB8fHx8&auto=format&fit=crop&w=1770&q=80") background-size: cover # .big-text.black[ R FOR BEGINNERS] <br> <br> <br> <br> <br> <br> .footnote[ .white[Image credits:][Kelly Sikkema ](https://unsplash.com/photos/p1ZgObLpa0A) ] --- class: middle .pull-left[ <img src="images/ajaykoli.png" width="70%" style="display: block; margin: auto auto auto 0;" /> Dr Ajay Kumar Koli<br>Head & Educator<br>School of Information & Data Science<br><svg viewBox="0 0 512 512" style="height:1em;position:relative;display:inline-block;top:.1em;" xmlns="http://www.w3.org/2000/svg"> <path d="M320 336c0 8.84-7.16 16-16 16h-96c-8.84 0-16-7.16-16-16v-48H0v144c0 25.6 22.4 48 48 48h416c25.6 0 48-22.4 48-48V288H320v48zm144-208h-80V80c0-25.6-22.4-48-48-48H176c-25.6 0-48 22.4-48 48v48H48c-25.6 0-48 22.4-48 48v80h512v-80c0-25.6-22.4-48-48-48zm-144 0H192V96h128v32z"></path></svg> [Nalanda Academy](https://nalanda-academy.org/) - Wardha<br><svg viewBox="0 0 512 512" style="height:1em;position:relative;display:inline-block;top:.1em;" xmlns="http://www.w3.org/2000/svg"> <path d="M459.37 151.716c.325 4.548.325 9.097.325 13.645 0 138.72-105.583 298.558-298.558 298.558-59.452 0-114.68-17.219-161.137-47.106 8.447.974 16.568 1.299 25.34 1.299 49.055 0 94.213-16.568 130.274-44.832-46.132-.975-84.792-31.188-98.112-72.772 6.498.974 12.995 1.624 19.818 1.624 9.421 0 18.843-1.3 27.614-3.573-48.081-9.747-84.143-51.98-84.143-102.985v-1.299c13.969 7.797 30.214 12.67 47.431 13.319-28.264-18.843-46.781-51.005-46.781-87.391 0-19.492 5.197-37.36 14.294-52.954 51.655 63.675 129.3 105.258 216.365 109.807-1.624-7.797-2.599-15.918-2.599-24.04 0-57.828 46.782-104.934 104.934-104.934 30.213 0 57.502 12.67 76.67 33.137 23.715-4.548 46.456-13.32 66.599-25.34-7.798 24.366-24.366 44.833-46.132 57.827 21.117-2.273 41.584-8.122 60.426-16.243-14.292 20.791-32.161 39.308-52.628 54.253z"></path></svg> [@ajay_kolii](https://twitter.com/ajay_kolii)<br><svg viewBox="0 0 512 512" style="height:1em;position:relative;display:inline-block;top:.1em;" xmlns="http://www.w3.org/2000/svg"> <path d="M464 64H48C21.49 64 0 85.49 0 112v288c0 26.51 21.49 48 48 48h416c26.51 0 48-21.49 48-48V112c0-26.51-21.49-48-48-48zm0 48v40.805c-22.422 18.259-58.168 46.651-134.587 106.49-16.841 13.247-50.201 45.072-73.413 44.701-23.208.375-56.579-31.459-73.413-44.701C106.18 199.465 70.425 171.067 48 152.805V112h416zM48 400V214.398c22.914 18.251 55.409 43.862 104.938 82.646 21.857 17.205 60.134 55.186 103.062 54.955 42.717.231 80.509-37.199 103.053-54.947 49.528-38.783 82.032-64.401 104.947-82.653V400H48z"></path></svg> [koliajaykumar@gmail.com](koliajaykumar@gmail.com) <br><svg viewBox="0 0 496 512" style="height:1em;position:relative;display:inline-block;top:.1em;" xmlns="http://www.w3.org/2000/svg"> <path d="M336.5 160C322 70.7 287.8 8 248 8s-74 62.7-88.5 152h177zM152 256c0 22.2 1.2 43.5 3.3 64h185.3c2.1-20.5 3.3-41.8 3.3-64s-1.2-43.5-3.3-64H155.3c-2.1 20.5-3.3 41.8-3.3 64zm324.7-96c-28.6-67.9-86.5-120.4-158-141.6 24.4 33.8 41.2 84.7 50 141.6h108zM177.2 18.4C105.8 39.6 47.8 92.1 19.3 160h108c8.7-56.9 25.5-107.8 49.9-141.6zM487.4 192H372.7c2.1 21 3.3 42.5 3.3 64s-1.2 43-3.3 64h114.6c5.5-20.5 8.6-41.8 8.6-64s-3.1-43.5-8.5-64zM120 256c0-21.5 1.2-43 3.3-64H8.6C3.2 212.5 0 233.8 0 256s3.2 43.5 8.6 64h114.6c-2-21-3.2-42.5-3.2-64zm39.5 96c14.5 89.3 48.7 152 88.5 152s74-62.7 88.5-152h-177zm159.3 141.6c71.4-21.2 129.4-73.7 158-141.6h-108c-8.8 56.9-25.6 107.8-50 141.6zM19.3 352c28.6 67.9 86.5 120.4 158 141.6-24.4-33.8-41.2-84.7-50-141.6h-108z"></path></svg> [https://koliajay.netlify.app/](https://koliajay.netlify.app/) ] .pull-right[ <br> <br> <br> <br> # .big-text[Hello! π] ] --- # Modules: 1. .b[[Basics of R & RStudio](#module1)] 1. [Dynamic Documents using R Markdown](#module2) 1. [Data Visualisation using ggplot2](#module3) 1. [Data Wrangling using dplyr](#module4) 1. [Slide Crafting using xaringan](#module5) --- name: module1 class: title-slide, right, middle, hide-count, hide-logo background-image: url("https://images.unsplash.com/photo-1513949474464-08a0bdb4fa54?ixlib=rb-1.2.1&ixid=MnwxMjA3fDB8MHxwaG90by1wYWdlfHx8fGVufDB8fHx8&auto=format&fit=crop&w=1770&q=80") background-size: cover # .white.big-text[R and<br>RStudio:<br>Basics] ## .white.black[Session - 1] .footnote[ .white[Image credits:][Kelly Sikkema ](https://unsplash.com/photos/p1ZgObLpa0A) ] --- class: hide-logo, center <iframe width="960" height="615" src="https://www.youtube.com/embed/K9WeFAEPo6I" title="YouTube video player" frameborder="0" allow="accelerometer; autoplay; clipboard-write; encrypted-media; gyroscope; picture-in-picture" allowfullscreen></iframe> --- background-image: url("https://github.com/allisonhorst/stats-illustrations/raw/master/rstats-artwork/r_first_then.png") background-size: contain .footnote[ [Source](https://github.com/allisonhorst/stats-illustrations) ] --- # π R is FREE - R is a language and environment for statistical computing and graphics. (R project) -- - In August 1993, designed by .pull-left[ <div class="figure" style="text-align: center"> <img src="https://cdn.auckland.ac.nz/aem/content/auckland/en/science/about-the-faculty/department-of-statistics/ihaka-lecture-series/_jcr_content/leftpar/imagecomponent/image.img.480.low.jpg/1561079330278.jpg" alt="Ross Ihaka <br>(New Zealand Statistician)" width="80%" /> <p class="caption">Ross Ihaka <br>(New Zealand Statistician)</p> </div> ] .pull-right[ <div class="figure" style="text-align: center"> <img src="https://www.computerhope.com/people/pictures/robert_gentleman.jpg" alt="Robert Gentleman<br>(Canadian Statistician)" width="50%" /> <p class="caption">Robert Gentleman<br>(Canadian Statistician)</p> </div> ] --- class: center # Download R from [CRAN](https://cran.r-project.org/mirrors.html) <img src="images/cran.png" width="80%" style="display: block; margin: auto;" /> --- class: right .pull-left[ # R Console ##- R version ##- R name ##- R licence ##- prompt `>` ] .pull-right[ <img src="images/console.png" width="100%" style="display: block; margin: auto auto auto 0;" /> ] --- # .red[Never Save R "Workspace Image":] .pull-left[ - It helps in "freshly minted R sessions". - "put more trust in your script than in your memory" .footnote[ [Source](https://www.r-bloggers.com/2017/04/using-r-dont-save-your-workspace/) ] ] .pull-right[ <img src="images/quit.png" width="75%" style="display: block; margin: auto;" /> ] --- # .center[R as a BIG calc] .pull-left[ ### .center[What you code] ```r *1 ``` ] .pull-right[ ### .center[What you see] ``` ## [1] 1 ``` ] --- # .center[R as a BIG calc] .pull-left[ ### .center[What you code] ```r 1 *1 + 1 ``` ] .pull-right[ ### .center[What you see] ``` ## [1] 1 ## [1] 2 ``` ] --- # .center[R as a BIG calc] .pull-left[ ### .center[What you code] ```r 1 1 + 1 *34 / 40 ``` ] .pull-right[ ### .center[What you see] ``` ## [1] 1 ## [1] 2 ## [1] 0.85 ``` ] --- # .center[R as a BIG calc] .pull-left[ ### .center[What you code] ```r 1 1 + 1 34 / 40 *5 < 4 ``` ] .pull-right[ ### .center[What you see] ``` ## [1] 1 ## [1] 2 ## [1] 0.85 ## [1] FALSE ``` ] --- # .center[R as a BIG calc] .pull-left[ ### .center[What you code] ```r 1 1 + 1 34 / 40 5 < 4 *16 == 16 ``` ] .pull-right[ ### .center[What you see] ``` ## [1] 1 ## [1] 2 ## [1] 0.85 ## [1] FALSE ## [1] TRUE ``` ] --- # .center[Plot using R] .panelset[ .panel[.panel-name[Code] ```r *plot(1:100) ``` ] .panel[.panel-name[Output] <img src="index_files/figure-html/unnamed-chunk-7-1.png" width="40%" style="display: block; margin: auto;" /> ] ] --- class: inverse, hide-count, center, bottom, hide-logo background-image: url("images/rainbowr.gif") background-size: 50% background-position: 50% 5% # .bottom.big-text[Functions] --- # R Function - "A function, in a programming environment, is a set of instructions. A programmer builds a function to avoid repeating the same task, or reduce complexity." <br> -- .panelset[ .panel[.panel-name[Code] ```r *round(9.1565, 2) ``` ] .panel[.panel-name[Output] ``` ## [1] 9.16 ``` ] ] --- class: center background-image: url("images/function-args.png") background-size: 90% background-position: 60% 70% # Structure of R function --- # .center[Round Function] .panelset[ .panel[.panel-name[Code] ```r round(x = 564.56743, digits = 2) ``` ] .panel[.panel-name[Output] ``` ## [1] 564.57 ``` ] ] --- # .center[Round Function] .panelset[ .panel[.panel-name[Code] ```r round(x = 564.56743, digits = 1) ``` ] .panel[.panel-name[Output] ``` ## [1] 564.6 ``` ] ] --- # .center[Square Root Function] .panelset[ .panel[.panel-name[Code] ```r *sqrt(x = 9) ``` ] .panel[.panel-name[Output] ``` ## [1] 3 ``` ] ] --- # .center[Sequence Function] .panelset[ .panel[.panel-name[Code] ```r *seq.int(from = 10, to = 30, by = 5) ``` ] .panel[.panel-name[Output] ``` ## [1] 10 15 20 25 30 ``` ] ] --- class: inverse, hide-count, center, bottom, hide-logo background-image: url("images/stormyr.gif") background-size: 42% background-position: 50% 5% # .bottom.big-text[Comments] --- # R Comment: - "Humans will be able to read the comments, but your computer will pass over them."<sup>1</sup> -- - In R, `#` is used as a commenting symbol .footnote[ [Source](https://en.wikipedia.org/wiki/Comment_(computer_programming) ] --- # .center[How to add comment?] .panelset[ .panel[.panel-name[Code] ```r # secret code of happiness (1 + 4) - (3 * 5) / 10 ## r does not evaluate this # all these are comments # comments are very important ``` ] .panel[.panel-name[Output] ``` ## [1] 3.5 ``` ] ] --- # πΌ *That's okay but you promise to...* -- - combine plot, text, tables and images in a single file. -- - publish my work online or convert into a word, pdf or html file. -- - work efficiently with my different projects and save, share and track them. -- ## .orange[WE NEED A SUPERHERO ... ] --- class: center, middle, hide-count, hide-logo background-image: url("https://www.rstudio.com/wp-content/uploads/2018/10/RStudio-Logo-Flat.png") background-size: contain --- class: hide-logo background-image: url("https://res-5.cloudinary.com/crunchbase-production/image/upload/c_thumb,h_256,w_256,f_auto,g_faces,z_0.7,q_auto:eco/v1398402407/chvmdsmomg96uoz8g3ad.jpg") background-size: 20% background-position: 99% 1% # π» About RStudio: - 2009, Joseph J. Allaire founded RStudio. -- - 2011, RStudio IDE for R was launched. -- - "RStudio is dedicated to sustainable investment in free and open-source software for data science." (16 Jan 2022) .footnote[ [Source](https://www.rstudio.com/about/) ] --- class: center # R `\(\rightleftharpoons\)` RStudio -- .pull-left[ ## Imagine RStudio as a stylish car ... # .big-text[π] ] -- .pull-right[ ## and R as its powerful engine. # .big-text[βοΈ] ] --- class: center # RStudio IDE <img src="images/rstd-ide.png" width="75%" style="display: block; margin: auto;" /> --- class: center ### RStudio `\(\rightarrow\)` Tools `\(\rightarrow\)` Global Options <img src="images/rstd-options.png" width="50%" style="display: block; margin: auto;" /> --- class: center ### RStudio `\(\rightarrow\)` Tools `\(\rightarrow\)` Global Options <img src="images/rstd-options2.png" width="50%" style="display: block; margin: auto;" /> --- background-image: url("images/learn.png") background-size: 125% background-color: #F5F4F2 .footnote[ [Source](https://education.rstudio.com) ] --- class: center middle # R Program <img src="images/data-science.png" width="100%" style="display: block; margin: auto;" /> .footnote[ [Source](https://r4ds.had.co.nz/introduction.html) ] --- class: center middle # Data Wrangling <img src="images/data-science-wrangle.png" width="100%" style="display: block; margin: auto;" /> .footnote[ [Source](https://r4ds.had.co.nz/introduction.html) ] --- class: center middle # Exploratory Data Analysis <img src="images/data-science-explore.png" width="100%" style="display: block; margin: auto;" /> .footnote[ [Source](https://r4ds.had.co.nz/introduction.html) ] --- class: center middle # Modeling <img src="images/data-science-model.png" width="100%" style="display: block; margin: auto;" /> .footnote[ [Source](https://r4ds.had.co.nz/introduction.html) ] --- class: center middle # Data Visualisation <img src="images/data-science-communicate.png" width="100%" style="display: block; margin: auto;" /> .footnote[ [Source](https://r4ds.had.co.nz/introduction.html) ] --- class: center middle # R Program <img src="images/data-science-program.png" width="100%" style="display: block; margin: auto;" /> .footnote[ [Source](https://r4ds.had.co.nz/introduction.html) ] --- class: hide-count, hide-logo background-image: url("https://pbs.twimg.com/media/FJJ3qyAXwAQSI8s?format=jpg&name=medium") background-size: 70% background-position: 70% .footnote[ [Source](https://www.business-science.io/learning-r/2018/11/04/data-science-r-cheatsheet.html) ] --- class: center, middle, hide-count, hide-logo background-image: url("images/space-pkgs.png") background-position: 110% background-size: contain .pull-left[ # .big-text[R<br>Packages] ] --- # R Packages: - On 12 Jan 2022, 18698 R packages were available at [CRAN](https://cran.r-project.org/web/packages/) -- - "An R package is a collection of functions, data, and documentation that extends the capabilities of base R. Using packages is key to the successful use of R." -- - Top downloaded packages [source](https://www.r-pkg.org/downloaded) .footnote[ [Source](https://r4ds.had.co.nz/introduction.html) ] --- class: center # To Download pkgs <img src="images/pkg-download1.png" width="65%" style="display: block; margin: auto;" /> --- class: center # Name of the R package(s) <img src="images/pkg-download2.png" width="65%" style="display: block; margin: auto;" /> --- class: center # Installed R package(s) <img src="images/pkg-download3.png" width="45%" style="display: block; margin: auto;" /> --- # R Function to Download Package ```r *install.packages("tidyverse") ``` -- # R Function to use Package ```r *library(tidyverse) ``` --- # About R Packages: - You need to install package only once like - π We buy books once and use them again and again -- - π‘ Fix the bulb once and use it again and again -- - In every R document you need to `call once` the package using function `library()`, for example library(ggplot2). -- - Once in a while, you need to update the installed packages as well. -- - If you un-install R or RStudio, you will lose all installed packages. --- class: center # Tools `\(\rightarrow\)` Check Package Updates <img src="images/update-pkg1.png" width="42%" style="display: block; margin: auto;" /> --- class: center # Select Package(s) to Update <img src="images/update-pkg2.png" width="60%" style="display: block; margin: auto;" /> --- class: center # Click Install Updates <img src="images/update-pkg3.png" width="60%" style="display: block; margin: auto;" /> --- class: center # To Remove Package(s) <img src="images/remove-pkg.png" width="40%" style="display: block; margin: auto;" /> --- class: inverse, your-turn, hide-logo # π§ YOUR TURN .panelset[ .panel[.panel-name[Task] - Install R packages `xaringan` & `palmerpenguins` - Call R packages using console ] .panel[.panel-name[Answer] ```r install.packages(c("xaringan", "palmerpenguins")) library(xaringan) library(palmerpenguins) ``` ] ]
05
:
00
--- class: hide-count, center, middle, hide-logo background-image: url("images/heartyr.gif") background-size: contain background-position: 5% # .right.big-text[Objects] --- # R Object ##- "Just a name that you can use to call up stored data" .footnote[ Source: [RStudio](https://rstudio-education.github.io/hopr/basics.html) ] --- # .center[Create Object] .panelset[ .panel[.panel-name[Code] ```r *salary <- c(20, 30, 40, 50, -10) *salary ``` ] .panel[.panel-name[Output] ``` ## [1] 20 30 40 50 -10 ``` ] ] --- # .center[Create Object] .panelset[ .panel[.panel-name[Code] ```r name <- c("Ram", "Rani", "Ali", "Preeti", "John") name ``` ] .panel[.panel-name[Output] ``` ## [1] "Ram" "Rani" "Ali" "Preeti" ## [5] "John" ``` ] ] --- # .center[Create Object] .panelset[ .panel[.panel-name[Code] ```r age <- c(34, 54, 23, 65, 2 ) age ``` ] .panel[.panel-name[Output] ``` ## [1] 34 54 23 65 2 ``` ] ] --- # .center[Create Object] .panelset[ .panel[.panel-name[Code] ```r place <- c("ny", "ber", "dhl", "tko", "lon") place ``` ] .panel[.panel-name[Output] ``` ## [1] "ny" "ber" "dhl" "tko" "lon" ``` ] ] --- # .center[Create Object] .panelset[ .panel[.panel-name[Code] ```r books <- c(4, 0, 3, 24, 5) books ``` ] .panel[.panel-name[Output] ``` ## [1] 4 0 3 24 5 ``` ] ] --- # Guidelines to name `objects` in R: - a name cannot start with a number -- - a name cannot use some special symbols, like ^, !, $, @, +, -, /, or *: -- - avoid caps -- - avoid space -- - use dash (like na-me) or underscore (like na_me) -- - if chronology matters then add date (2020-09-05-file-name) --- class: center # RStudio Environment Window <img src="images/env-rstd.png" width="70%" style="display: block; margin: auto;" /> -- ## π€.i.green[how to combine these<br> objects/variables into a data or say tidy data] --- exclude: true class: hide-count, hide-logo background-image: url("images/tidydata_7.jpg") background-size: cover --- exclude: true class: hide-count, hide-logo background-image: url("images/tidydata_1_1.jpg") background-size: contain --- exclude: true class: hide-count background-image: url("images/tidydata_1_2.jpg") background-size: contain --- exclude: true class: hide-count background-image: url("images/tidydata_2_1.jpg") background-size: contain --- exclude: true class: hide-count background-image: url("images/tidydata_2_2.jpg") background-size: contain --- class: center # Tidy data π π»π»π» ``` ## age books name place salary ## 1 34 4 Ram ny 20 ## 2 54 0 Rani ber 30 ## 3 23 3 Ali dhl 40 ## 4 65 24 Preeti tko 50 ## 5 2 5 John lon -10 ``` -- <img src="images/tidy-1.png" width="70%" style="display: block; margin: auto;" /> .footnote[ [Source](https://r4ds.had.co.nz/index.html) ] --- # .center[How to create a data object?] .panelset[ .panel[.panel-name[Code] ```r *social <- data.frame(age, books, name, place, salary) social ``` ] .panel[.panel-name[Output] ``` ## age books name place salary ## 1 34 4 Ram ny 20 ## 2 54 0 Rani ber 30 ## 3 23 3 Ali dhl 40 ## 4 65 24 Preeti tko 50 ## 5 2 5 John lon -10 ``` ] ] --- # .center[How to export data as a csv file?] .panelset[ .panel[.panel-name[Code] ```r library(readr) # to save this data set as a csv file *write_csv(social, "data/social.csv") ``` ] .panel[.panel-name[Output] ] ] --- class: your-turn, hide-count, hide-logo # π§ YOUR TURN ## .yellow[Write codes for below dataframe] .panelset[ .panel[.panel-name[Task] ``` ## state pop capital foundation ## 1 Germany 20 Berlin 1870-12-10 ## 2 France 19 Paris 1789-07-14 ## 3 India 50 Delhi 1947-08-15 ## 4 Russia 25 Moscow 1990-06-12 ## 5 USA 30 Washington 1776-07-04 ## 6 New Zealand 5 Wellington 1840-02-06 ``` ] .panel[.panel-name[Answer] ```r state <- c("Germany", "France", "India", "Russia", "USA", "New Zealand") pop <- c(20, 19, 50, 25, 30, 5) capital <- c("Berlin", "Paris", "Delhi", "Moscow", "Washington", "Wellington") foundation <- c("1870-12-10", "1789-07-14", "1947-08-15", "1990-06-12", "1776-07-04", "1840-02-06") world <- data.frame(state, pop, capital, foundation) world ``` ] ]
10
:
00
--- # .center[Get a List of all Objects] .panelset[ .panel[.panel-name[Code] ```r # names of created objects *objects() ``` ] .panel[.panel-name[Output] ``` ## [1] "age" "books" "capital" ## [4] "foundation" "name" "place" ## [7] "pop" "praw" "salary" ## [10] "soc" "social" "state" ## [13] "world" ``` ] ] --- class: center, middle, hide-count, hide-logo background-image: url("images/breakr.gif") background-size: 50% background-position: 90% .pull-left[ # .big-text[Need Help!] ] --- class: center # Using Console `>` ## in console type `?your query` -- <br><br>.green[for example] `?ggplot` --- class: center # RStudio: pkg Help Docs <img src="images/help-cran.png" width="60%" style="display: block; margin: auto;" /> --- class: center # [RStudio Community](https://community.rstudio.com/) <br> <img src="images/help-rstd.png" width="90%" style="display: block; margin: auto;" /> --- class: center # [stackoverflow](https://stackoverflow.com/) <br> <img src="images/help-stack.png" width="90%" style="display: block; margin: auto;" /> --- class: center # [GitHub Issues](https://github.com/) <img src="images/help-git.png" width="100%" style="display: block; margin: auto;" /> --- class: center # [Twitter](https://twitter.com/home) #rstats <img src="images/help-tweet.png" width="60%" style="display: block; margin: auto;" /> --- class: center middle hide-count # ππ½ββοΈπββοΈ<br>.big-text[Q&A] --- class: center, middle, inverse # Dynamic Documents<br>Using R Markdown ### .orange[Next Module - 2] --- # Modules: 1. [Basics of R & RStudio](#module1) 1. .b[[Dynamic Documents using R Markdown](#module2)] 1. [Data Visualisation using ggplot2](#module3) 1. [Data Wrangling using dplyr](#module4) 1. [Slide Crafting using xaringan](#module5) --- name: module2 class: title-slide, hide-count, hide-logo background-image: url("https://images.unsplash.com/photo-1617063033111-74cf600531d8?ixlib=rb-1.2.1&ixid=MnwxMjA3fDB8MHxwaG90by1wYWdlfHx8fGVufDB8fHx8&auto=format&fit=crop&w=1776&q=80") background-size: cover # .white.big-text[Dynamic Documents] ## .white[Session - 2] <br> <br> <br> <br> <br> .footnote[ .white[Image credits:][John Anvik](https://images.unsplash.com/photo-1617063033111-74cf600531d8?ixlib=rb-1.2.1&ixid=MnwxMjA3fDB8MHxwaG90by1wYWdlfHx8fGVufDB8fHx8&auto=format&fit=crop&w=1776&q=80) ] --- class: hide-logo, center <iframe width="960" height="615" src="https://www.youtube.com/embed/6Ro9K2mV5Co" title="YouTube video player" frameborder="0" allow="accelerometer; autoplay; clipboard-write; encrypted-media; gyroscope; picture-in-picture" allowfullscreen></iframe> --- class: center # Open RStudio <img src="images/rstd-proj.png" width="75%" style="display: block; margin: auto;" /> --- class: center # Open RStudio <img src="images/rstd-proj-none.png" width="75%" style="display: block; margin: auto;" /> --- class: center # Open RStudio <img src="images/rstd-proj-folders.png" width="75%" style="display: block; margin: auto;" /> --- class: hide-logo, hide-count, left, middle background-image: url("images/project-logo.png") background-size: contain background-position: 110% # .big-text[RStudio<br>Project] --- background-image: url("images/r-projects.jpg") background-size: 62% background-position: 100% 80% # About RStudio Projects - "to divide your work into multiple contexts, each with their own: -- - working directory, -- - workspace, -- - history, and -- - source documents." .footnote[ [Source](https://support.rstudio.com/hc/en-us/articles/200526207-Using-Projects) & Artwork [Source](https://www.allisonhorst.com/) ] --- class: center, middle, hide-count # π₯ Create RStudio Project in 4 Steps π₯ --- class: center, middle # Create RStudio Project in 4 Steps <img src="images/rstd-proj-1.png" width="65%" style="display: block; margin: auto;" /> --- class: center, middle # Create RStudio Project in 4 Steps <img src="images/rstd-proj-2.png" width="65%" style="display: block; margin: auto;" /> --- class: center, middle # Create RStudio Project in 4 Steps <img src="images/rstd-proj-3.png" width="65%" style="display: block; margin: auto;" /> --- class: center, middle # Create RStudio Project in 4 Steps <img src="images/rstd-proj-4.png" width="65%" style="display: block; margin: auto;" /> --- class: center # Open RStudio Project <img src="images/rstd-project-name.png" width="75%" style="display: block; margin: auto;" /> --- class: center # Open RStudio Project <img src="images/rstd-project-path.png" width="75%" style="display: block; margin: auto;" /> --- class: center # Open RStudio Project <img src="images/rstd-project-path2.png" width="75%" style="display: block; margin: auto;" /> --- class: hide-count, middle, left, hide-logo background-image: url("images/logo-rmd.png") background-size: contain background-position: right # .big-text[R<br>Package] --- # About R Markdown: - "You bring your data, code, and ideas, and R Markdown renders your content into a polished document that can be used to: -- - Do data science interactively within the RStudio IDE, -- - Reproduce your analyses, -- - Collaborate and share code with others, and -- - Communicate your results with others." .footnote[ [Source](https://github.com/rstudio/rmarkdown) ] --- class: middle, center, hide-logo, hide-count <iframe src="https://player.vimeo.com/video/178485416?color=428bca" width="840" height="500" frameborder="0" allow="autoplay; fullscreen" allowfullscreen></iframe> <p><a href="https://vimeo.com/178485416">What is R Markdown?</a> from <a href="https://vimeo.com/rstudioinc">RStudio, Inc.</a> on <a href="https://vimeo.com">Vimeo</a>.</p> --- class: center, middle, hide-logo, hide-count # π₯How to create R Markdown file?π₯ --- class: center # File `\(\rightarrow\)` New File `\(\rightarrow\)` R Markdown <img src="images/script-new.png" width="78%" style="display: block; margin: auto;" /> --- class: center # R Markdown <img src="images/script-options.png" width="65%" style="display: block; margin: auto;" /> --- class: center # R Markdown <img src="images/script-options1.png" width="65%" style="display: block; margin: auto;" /> --- class: center # R Markdown <img src="images/script-options2.png" width="65%" style="display: block; margin: auto;" /> --- class: center # R Markdown <img src="images/script-options3.png" width="65%" style="display: block; margin: auto;" /> --- class: center # Save your .Rmd file <img src="images/script-save.png" width="65%" style="display: block; margin: auto;" /> --- class: center # Name your .Rmd file <img src="images/script-title.png" width="85%" style="display: block; margin: auto;" /> --- class: center # Name your .Rmd file <img src="images/script-title1.png" width="85%" style="display: block; margin: auto;" /> --- class: center # Save your .Rmd file <img src="images/script-title2.png" width="85%" style="display: block; margin: auto;" /> --- class: center # Saved .Rmd file `\(\rightarrow\)` in RStudio Project <img src="images/script-saved.png" width="75%" style="display: block; margin: auto;" /> --- exclude: true class: center background-image: url("images/script-to-console1.png") background-size: 70% background-position: center bottom # Script file for writing the codes --- exclude: true class: center background-image: url("images/script-to-console2.png") background-size: 70% background-position: center bottom # Console to process the codes --- exclude: true class: center background-image: url("images/script-to-console3.png") background-size: 70% background-position: center bottom # R Script `\(\rightarrow\)` Console `\(\rightarrow\)` Output --- exclude: true class: center background-image: url("images/script-to-console4.png") background-size: 70% background-position: center bottom # R Script `\(\rightarrow\)` Console `\(\rightarrow\)` Output --- class: center, middle .pull-left[ <img src="images/rmd-input.png" width="100%" style="display: block; margin: auto;" /> ] .pull-right[ <img src="images/rmd-output.png" width="100%" style="display: block; margin: auto;" /> ] --- background-image: url("images/knit-html.png") background-size: contain background-position: center middle --- # R Markdown has 3 important parts: ##- .purple[YAML] ##- .orange[Code chunk] ##- .blue[Text] --- background-image: url("images/temp-yaml.png") background-size: cover background-position: left --- background-image: url("images/temp-chunk.png") background-size: cover background-position: left --- background-image: url("images/temp-text.png") background-size: cover background-position: left --- # π§Ά Knit a R Markdown File - YAML options - Headings, subheadings, text & maths equations - Code Chunk - Include images - Include tables - Include plot - Themes - Multiple Output Formats - [eBook](https://bookdown.org/yihui/rmarkdown-cookbook/) --- class: center middle hide-count # ππ½ββοΈπββοΈ<br>.big-text[Q&A] --- class: center, middle, inverse # Dynamic Visualisation<br>Using ggplot2 ### .orange[Next Module - 3] --- # Modules: 1. [Basics of R & RStudio](#module1) 1. [Dynamic Documents using R Markdown](#module2) 1. .b[[Data Visualisation using ggplot2](#module3)] 1. [Data Wrangling using dplyr](#module4) 1. [Slide Crafting using xaringan](#module5) --- name: module3 class: title-slide, center, middle, hide-count, hide-logo background-image: url("https://images.unsplash.com/photo-1617164924207-40e6ee7c3ffe?ixlib=rb-1.2.1&ixid=MnwxMjA3fDB8MHxwaG90by1wYWdlfHx8fGVufDB8fHx8&auto=format&fit=crop&w=1740&q=80") background-size: cover # .white.big-text[Data Visualisation] ## .white[Session - 3] .footnote[ .white[Image credits:][Kayvan Mazhar](https://unsplash.com/photos/SfxhjdST3Qs) ] --- class: hide-logo, center <iframe width="960" height="615" src="https://www.youtube.com/embed/Jp_Ep1RiAtk" title="YouTube video player" frameborder="0" allow="accelerometer; autoplay; clipboard-write; encrypted-media; gyroscope; picture-in-picture" allowfullscreen></iframe> --- class: center # Course Progress <img src="images/data-science-communicate.png" width="100%" style="display: block; margin: auto;" /> --- class: left, middle, hide-count, hide-logo background-image: url("images/not_normal.png") background-size: 70% background-position: right # .big-text[Data] .footnote[ [Artwork Source](https://www.allisonhorst.com/) ] --- # Variable types in R: -- - `int` stands for integers, like 4, 55, 300. -- - `dbl` stands for doubles, or real numbers like 3, 7.45, 1.565, 12. -- - `chr` stands for character vectors, or strings like names. -- - `dttm` stands for date-times (a date + a time). -- - `lgl` stands for logical, vectors that contain only TRUE or FALSE. -- - `fct` stands for factors, which R uses to represent **categorical variables** with fixed possible values like occupation: student, professional, government, business. -- - `date` stands for dates. --- class: hide-logo background-image: url("images/culmen_depth.png") background-size: 25% background-position: 95% 5% # Data of Palmer Penguins - It comes with R package `palmerpenguins` -- - Name of the data is `penguins` -- - To know more about the data `?penguins` -- - Included variables are: - species, island, bill_length_mm, bill_depth_mm, flipper_length_mm, body_mass_g, sex, year .footnote[ [Artwork Source](https://www.allisonhorst.com/) ] --- # An Overview of Data .panelset[ .panel[.panel-name[Codes] ```r *glimpse(penguins) ``` ] .panel[.panel-name[Output] ``` ## Rows: 344 ## Columns: 8 ## $ species <fct> Adelie, Adelie, β¦ ## $ island <fct> Torgersen, Torgeβ¦ ## $ bill_length_mm <dbl> 39.1, 39.5, 40.3β¦ ## $ bill_depth_mm <dbl> 18.7, 17.4, 18.0β¦ ## $ flipper_length_mm <int> 181, 186, 195, Nβ¦ ## $ body_mass_g <int> 3750, 3800, 3250β¦ ## $ sex <fct> male, female, feβ¦ ## $ year <int> 2007, 2007, 2007β¦ ``` ] ] --- ### An Overview of Data .panelset[ .panel[.panel-name[Codes] ```r *summary(penguins) ``` ] .panel[.panel-name[Output] ``` ## species island ## Adelie :152 Biscoe :168 ## Chinstrap: 68 Dream :124 ## Gentoo :124 Torgersen: 52 ## ## ## ## ## bill_length_mm bill_depth_mm ## Min. :32.10 Min. :13.10 ## 1st Qu.:39.23 1st Qu.:15.60 ## Median :44.45 Median :17.30 ## Mean :43.92 Mean :17.15 ## 3rd Qu.:48.50 3rd Qu.:18.70 ## Max. :59.60 Max. :21.50 ## NA's :2 NA's :2 ## flipper_length_mm body_mass_g ## Min. :172.0 Min. :2700 ## 1st Qu.:190.0 1st Qu.:3550 ## Median :197.0 Median :4050 ## Mean :200.9 Mean :4202 ## 3rd Qu.:213.0 3rd Qu.:4750 ## Max. :231.0 Max. :6300 ## NA's :2 NA's :2 ## sex year ## female:165 Min. :2007 ## male :168 1st Qu.:2007 ## NA's : 11 Median :2008 ## Mean :2008 ## 3rd Qu.:2009 ## Max. :2009 ## ``` ] ] --- # Packages required: ```r library(palmerpenguins) # to access penguin data library(tidyverse) # to use ggplot2 pkg ``` - Packages recommended: ```r install.packages(c( "directlabels", "dplyr", "gameofthrones", "ggforce", "gghighlight", "ggnewscale", "ggplot2", "ggraph", "ggrepel", "ggtext", "ggthemes", "hexbin", "mapproj", "maps", "munsell", "ozmaps", "paletteer", "patchwork", "rmapshaper", "scico", "seriation", "sf", "stars", "tidygraph", "tidyr", "wesanderson" )) ``` --- class: left, middle, hide-count, hide-logo background-image: url("images/ggplot-logo.png") background-size: contain background-position: 100% 50% # .big-text[R<br>Package] --- # ggplot2 by [Hadley Wickham](http://hadley.nz/) <br> - "is a system for declaratively creating graphics, based on [The Grammar of Graphics](https://www.springer.com/gp/book/9780387245447)" (book by Late Leland Wilkinson) .pull-left[ <div class="figure" style="text-align: center"> <img src="https://upload.wikimedia.org/wikipedia/en/b/b5/Leland_Wilkinson.png" alt="Late Leland Wilkinson" width="40%" /> <p class="caption">Late Leland Wilkinson</p> </div> ] .pull-right[ <div class="figure" style="text-align: center"> <img src="images/hadley.jpg" alt="Hadley Wickham" width="58%" /> <p class="caption">Hadley Wickham</p> </div> ] .footnote[ [Source](https://ggplot2.tidyverse.org/) ] --- class: hide-count, hide-logo background-image: url("images/layer7.png") background-size: contain background-position: 50% 50% .footnote[ [Source](https://www.ericchowkokyew.com/data-visualization-with-ggplot2-in-r/) ] --- # Key Components for ggplot2 Plot 1. data, 1. aesthetic mapping 1. at least one layer of geom function --- .panelset[ .panel[.panel-name[Task] <img src="images/layer1.png" width="45%" style="display: block; margin: auto;" /> ] .panel[.panel-name[Codes] ```r *ggplot(data = penguins) ``` ] .panel[.panel-name[Output] <img src="index_files/figure-html/unnamed-chunk-67-1.png" width="504" style="display: block; margin: auto;" /> ] ] --- .panelset[ .panel[.panel-name[Task] <img src="images/layer2.png" width="45%" style="display: block; margin: auto;" /> ] .panel[.panel-name[Codes] ```r *ggplot(data = penguins, mapping = aes(x = species)) ``` ] .panel[.panel-name[Output] <img src="index_files/figure-html/unnamed-chunk-68-1.png" width="504" style="display: block; margin: auto;" /> ] ] --- .panelset[ .panel[.panel-name[Task] <img src="images/layer3.png" width="45%" style="display: block; margin: auto;" /> ] .panel[.panel-name[Codes] ```r ggplot(data = penguins, mapping = aes(x = species)) + * geom_bar() ``` ] .panel[.panel-name[Output] <img src="index_files/figure-html/unnamed-chunk-69-1.png" width="504" style="display: block; margin: auto;" /> ] ] --- .panelset[ .panel[.panel-name[Codes] ```r ggplot(penguins, aes(x = species)) + geom_bar() ``` ] .panel[.panel-name[Output] <img src="index_files/figure-html/unnamed-chunk-70-1.png" width="504" style="display: block; margin: auto;" /> ] ] --- class: your-turn, hide-logo # π§ YOUR TURN
05
:
00
.panelset[ .panel[.panel-name[Output] <img src="index_files/figure-html/unnamed-chunk-72-1.png" width="38%" style="display: block; margin: auto;" /> ] .panel[.panel-name[Codes] ```r ggplot(data = penguins, mapping = aes(x = island)) + geom_bar() ``` ] ] --- class: center, middle # How to export plot to your computer? --- .panelset[ .panel[.panel-name[Codes] ```r ggplot(data = penguins, mapping = aes(x = species)) + geom_bar() *ggsave("peng-species.pdf") # also try jpg/jpeg/png ``` ] .panel[.panel-name[Output] <img src="index_files/figure-html/unnamed-chunk-73-1.png" width="504" style="display: block; margin: auto;" /> ``` ## Saving 7 x 7 in image ``` ] ] --- class: center, middle # How to add color to bars? --- .panelset[ .panel[.panel-name[Codes] ```r ggplot(data = penguins, mapping = aes(x = species)) + * geom_bar(fill = "blue") ``` ] .panel[.panel-name[Output] <img src="index_files/figure-html/unnamed-chunk-74-1.png" width="504" style="display: block; margin: auto;" /> ] ] --- .panelset[ .panel[.panel-name[Codes] ```r ggplot(data = penguins, mapping = aes(x = species)) + * geom_bar(fill = c("orange", "white", "green")) # color names should be equal to the factor levels # in case of factor species levels are three # Adele, Chinstrap & Gentoo ``` ] .panel[.panel-name[Output] <img src="index_files/figure-html/unnamed-chunk-75-1.png" width="504" style="display: block; margin: auto;" /> ] ] --- class: center, middle # How to add color using palette? π¨ --- ## π¨ Color Palette - R package `RColorBrewer` & `wesanderson` <img src="index_files/figure-html/unnamed-chunk-76-1.png" width="1224" style="display: block; margin: auto;" /> --- .panelset[ .panel[.panel-name[Codes] ```r library(RColorBrewer) ggplot(data = penguins, mapping = aes(x = species, * fill = species)) + geom_bar() + * scale_fill_brewer(palette = "Dark2") ``` ] .panel[.panel-name[Output] <img src="index_files/figure-html/unnamed-chunk-77-1.png" width="504" style="display: block; margin: auto;" /> ] ] --- class: center, middle # How to remove legend or change its position? --- .panelset[ .panel[.panel-name[Codes] ```r ggplot(data = penguins, mapping = aes(x = species, fill = species)) + geom_bar() + scale_fill_brewer(palette = "Dark2") + theme(legend.position = "none") # top, bottom, left ``` ] .panel[.panel-name[Output] <img src="index_files/figure-html/unnamed-chunk-78-1.png" width="504" style="display: block; margin: auto;" /> ] ] --- class: center, middle # How to plot title and axis titles? --- .panelset[ .panel[.panel-name[Codes] ```r ggplot(data = penguins, mapping = aes(x = species, fill = species)) + geom_bar() + scale_fill_brewer(palette = "Dark2") + theme(legend.position = "none") + labs( title = "Species of palmer penguins", subtitle = "This data is about penguins", x = "Species", y = "Frequency" ) ``` ] .panel[.panel-name[Output] <img src="index_files/figure-html/unnamed-chunk-79-1.png" width="504" style="display: block; margin: auto;" /> ] ] --- class: center, middle # How to control size of text? --- .panelset[ .panel[.panel-name[Codes] ```r ggplot(data = penguins, mapping = aes(x = species, fill = species)) + geom_bar() + scale_fill_brewer(palette = "Dark2") + theme(legend.position = "none", * text = element_text(size = 20)) + labs( title = "Species of palmer penguins", subtitle = "This data is about penguins", x = "Species", y = "Frequency" ) ``` ] .panel[.panel-name[Output] <img src="index_files/figure-html/unnamed-chunk-80-1.png" width="504" style="display: block; margin: auto;" /> ] ] --- class: center, middle # How to plot two numeric variables? --- .panelset[ .panel[.panel-name[Codes] ```r ggplot(data = penguins, mapping = aes(x = bill_length_mm, y = bill_depth_mm, color = species)) + geom_point() + scale_fill_brewer(palette = "Dark2") + theme(legend.position = "none", * text = element_text(size = 20)) + labs( title = "Relationship between bill length \n& depth of palmer penguins", subtitle = "This data is about penguins", x = "Bill length (mm)", y = "Bith depth (mm)" ) ``` ] .panel[.panel-name[Output] <img src="index_files/figure-html/unnamed-chunk-81-1.png" width="504" style="display: block; margin: auto;" /> ] ] --- class: center, middle # How to add themes to ggplot? --- # ggplot2 themes <https://ggplot2.tidyverse.org/reference/ggtheme.html> - theme_gray() - theme_bw() - theme_linedraw() - theme_light() - theme_dark() - theme_minimal() - theme_classic() - theme_void() - theme_test() --- .panelset[ .panel[.panel-name[Codes] ```r ggplot(data = penguins, mapping = aes(x = bill_length_mm, y = bill_depth_mm, color = species)) + geom_point() + scale_fill_brewer(palette = "Dark2") + theme(legend.position = "none", text = element_text(size = 20)) + labs( title = "Relationship between bill length \n& depth of palmer penguins", subtitle = "This data is about penguins", x = "Bill length (mm)", y = "Bith depth (mm)" ) + * theme_bw() ``` ] .panel[.panel-name[Output] <img src="index_files/figure-html/unnamed-chunk-82-1.png" width="504" style="display: block; margin: auto;" /> ] ] --- .panelset[ .panel[.panel-name[Codes] ```r ggplot(data = penguins, mapping = aes(x = bill_length_mm, y = bill_depth_mm, color = species)) + geom_point() + scale_fill_brewer(palette = "Dark2") + theme(legend.position = "none", * text = element_text(size = 20)) + labs( title = "Relationship between bill length \n& depth of palmer penguins", subtitle = "This data is about penguins", x = "Bill length (mm)", y = "Bith depth (mm)" ) + theme_classic() ``` ] .panel[.panel-name[Output] <img src="index_files/figure-html/unnamed-chunk-83-1.png" width="504" style="display: block; margin: auto;" /> ] ] --- class: center, middle # How to add regression line to ggplot? --- .panelset[ .panel[.panel-name[Codes] ```r ggplot(data = penguins, mapping = aes(x = flipper_length_mm, y = body_mass_g)) + geom_point() + theme(legend.position = "none", text = element_text(size = 24)) + labs( title = "Relationship between bill length \n& depth of palmer penguins", subtitle = "This data is about penguins", x = "Flipper length (mm)", y = "Body mass (gm)" ) + theme_classic() + * geom_smooth() ``` ] .panel[.panel-name[Output] <img src="index_files/figure-html/unnamed-chunk-84-1.png" width="504" style="display: block; margin: auto;" /> ] ] --- # More resources - ggplot2 book https://ggplot2-book.org/ - CΓDRIC SCHERER https://www.cedricscherer.com/ - ggplot2 cook book http://www.cookbook-r.com/ --- class: center middle hide-count # ππ½ββοΈπββοΈ<br>.big-text[Q&A] --- class: center, middle, inverse # Dynamic Wrangling<br>Using dplyr ### .orange[Next Module - 4] --- # Modules: 1. [Basics of R & RStudio](#module1) 1. [Dynamic Documents using R Markdown](#module2) 1. [Data Visualisation using ggplot2](#module3) 1. .b[[Data Wrangling using dplyr](#module4)] 1. [Slide Crafting using xaringan](#module5) --- name: module4 class: title-slide, right, middle, hide-count, hide-logo background-image: url("https://images.unsplash.com/photo-1591903934817-c02acbfd4665?ixlib=rb-1.2.1&ixid=MnwxMjA3fDB8MHxwaG90by1wYWdlfHx8fGVufDB8fHx8&auto=format&fit=crop&w=1932&q=80") background-size: cover <br> <br> <br> <br> # .black.big-text[Data<br>Wrangling] ## .black[Session - 4] .footnote[ .white[Image credits:][Karina L](https://unsplash.com/photos/zJRQ5nngdPA) ] --- class: hide-logo, center <iframe width="960" height="615" src="https://www.youtube.com/embed/QGj8hEcDW0E" title="YouTube video player" frameborder="0" allow="accelerometer; autoplay; clipboard-write; encrypted-media; gyroscope; picture-in-picture" allowfullscreen></iframe> --- class: center # Course Progress <img src="images/data-science-wrangle.png" width="100%" style="display: block; margin: auto;" /> --- # What is Data wrangling? -- - "data exploration and data manipulation" [(Jesse Mostipak)](https://www.kaggle.com/jessemostipak/dive-into-dplyr-tutorial-1) -- - "tidying and transforming" [(Hadley & Garrett)](https://r4ds.had.co.nz/index.html) -- <img src="images/tidy-1.png" width="100%" style="display: block; margin: auto;" /> --- # "Transforming" data means: - "narrowing in on observations of interest ... -- - creating new variables that are functions of existing variables ... and -- - calculating a set of summary statistics." .footnote[[Source](https://r4ds.had.co.nz/index.html)] --- class: hide-count, middle, hide-logo background-image: url(images/dplyr.svg) background-size: contain background-position: right # .big-text[R<br>Package] --- # `dplyr` package - "dplyr is a grammar of data manipulation" -- - "providing a consistent set of verbs that help you solve the most common data manipulation challenges:" -- - Few important functions: - `filter()` - `select()` - `mutate()` - `arrange()` - `summarise()` .footnote[ [Source](https://dplyr.tidyverse.org/) ] --- # `filter()` function: - Picks cases based on their values. <img src="images/01-filter.png" width="65%" style="display: block; margin: auto;" /> --- class: center, middle # How to have a data of only Gentoo penguins? --- .panelset[ .panel[.panel-name[Codes] ```r # there are three species: Chinstrap, Gentoo, Adelie penguins %>% * filter(species == "Gentoo") ``` ] .panel[.panel-name[Output] ``` ## # A tibble: 124 Γ 8 ## species island bill_length_mm ## <fct> <fct> <dbl> ## 1 Gentoo Biscoe 46.1 ## 2 Gentoo Biscoe 50 ## 3 Gentoo Biscoe 48.7 ## 4 Gentoo Biscoe 50 ## 5 Gentoo Biscoe 47.6 ## 6 Gentoo Biscoe 46.5 ## 7 Gentoo Biscoe 45.4 ## 8 Gentoo Biscoe 46.7 ## 9 Gentoo Biscoe 43.3 ## 10 Gentoo Biscoe 46.8 ## # β¦ with 114 more rows, and 5 more ## # variables: bill_depth_mm <dbl>, ## # flipper_length_mm <int>, ## # body_mass_g <int>, sex <fct>, ## # year <int> ``` ] ] --- .panelset[ .panel[.panel-name[Codes] ```r # there are three species: Chinstrap, Gentoo, Adelie praw <- read_csv("data/gentoo-penguins1.csv") praw %>% filter(species == "Gentoo") %>% summary() %>% kableExtra::kable() ``` ] .panel[.panel-name[Output] <table> <thead> <tr> <th style="text-align:left;"> </th> <th style="text-align:left;"> species </th> <th style="text-align:left;"> island </th> <th style="text-align:left;"> bill_length_mm </th> <th style="text-align:left;"> bill_depth_mm </th> <th style="text-align:left;"> flipper_length_mm </th> <th style="text-align:left;"> body_mass_g </th> <th style="text-align:left;"> sex </th> <th style="text-align:left;"> year </th> </tr> </thead> <tbody> <tr> <td style="text-align:left;"> </td> <td style="text-align:left;"> Length:124 </td> <td style="text-align:left;"> Length:124 </td> <td style="text-align:left;"> Min. :40.90 </td> <td style="text-align:left;"> Min. :13.10 </td> <td style="text-align:left;"> Min. :203.0 </td> <td style="text-align:left;"> Min. :3950 </td> <td style="text-align:left;"> Length:124 </td> <td style="text-align:left;"> Min. :2007 </td> </tr> <tr> <td style="text-align:left;"> </td> <td style="text-align:left;"> Class :character </td> <td style="text-align:left;"> Class :character </td> <td style="text-align:left;"> 1st Qu.:45.30 </td> <td style="text-align:left;"> 1st Qu.:14.20 </td> <td style="text-align:left;"> 1st Qu.:212.0 </td> <td style="text-align:left;"> 1st Qu.:4500 </td> <td style="text-align:left;"> Class :character </td> <td style="text-align:left;"> 1st Qu.:2007 </td> </tr> <tr> <td style="text-align:left;"> </td> <td style="text-align:left;"> Mode :character </td> <td style="text-align:left;"> Mode :character </td> <td style="text-align:left;"> Median :47.30 </td> <td style="text-align:left;"> Median :15.00 </td> <td style="text-align:left;"> Median :216.0 </td> <td style="text-align:left;"> Median :4925 </td> <td style="text-align:left;"> Mode :character </td> <td style="text-align:left;"> Median :2008 </td> </tr> <tr> <td style="text-align:left;"> </td> <td style="text-align:left;"> NA </td> <td style="text-align:left;"> NA </td> <td style="text-align:left;"> Mean :47.50 </td> <td style="text-align:left;"> Mean :14.98 </td> <td style="text-align:left;"> Mean :217.2 </td> <td style="text-align:left;"> Mean :4985 </td> <td style="text-align:left;"> NA </td> <td style="text-align:left;"> Mean :2008 </td> </tr> <tr> <td style="text-align:left;"> </td> <td style="text-align:left;"> NA </td> <td style="text-align:left;"> NA </td> <td style="text-align:left;"> 3rd Qu.:49.55 </td> <td style="text-align:left;"> 3rd Qu.:15.70 </td> <td style="text-align:left;"> 3rd Qu.:221.0 </td> <td style="text-align:left;"> 3rd Qu.:5400 </td> <td style="text-align:left;"> NA </td> <td style="text-align:left;"> 3rd Qu.:2009 </td> </tr> <tr> <td style="text-align:left;"> </td> <td style="text-align:left;"> NA </td> <td style="text-align:left;"> NA </td> <td style="text-align:left;"> Max. :59.60 </td> <td style="text-align:left;"> Max. :17.30 </td> <td style="text-align:left;"> Max. :231.0 </td> <td style="text-align:left;"> Max. :6050 </td> <td style="text-align:left;"> NA </td> <td style="text-align:left;"> Max. :2009 </td> </tr> <tr> <td style="text-align:left;"> </td> <td style="text-align:left;"> NA </td> <td style="text-align:left;"> NA </td> <td style="text-align:left;"> NA's :1 </td> <td style="text-align:left;"> NA's :1 </td> <td style="text-align:left;"> NA's :1 </td> <td style="text-align:left;"> NA's :1 </td> <td style="text-align:left;"> NA </td> <td style="text-align:left;"> NA </td> </tr> </tbody> </table> ] ] --- class: center, middle # How to export data file to your computer? --- .panelset[ .panel[.panel-name[Codes] ```r # three species are Chinstrap, Gentoo, Adelie penguins %>% filter(species == "Gentoo") %>% * write_csv("data/gentoo-penguins.csv") ``` ] .panel[.panel-name[Output] ] ] --- # β WAIT! What is `%>% ` -- - this is called **pipe** ( `%>%` = control + shift + m) -- - "a powerful tool for clearly expressing a sequence of **multiple operations**" -- - interpret/read it as **then**. ```r penguins %>% filter(species == "Gentoo") %>% summary() %>% kableExtra::kable() ``` --- # Comparison: Relational Operators `x < y` -- `x > y` -- `x <= y` -- `x >= y` -- `x == y` (equal) -- `x != y` (not equal) --- class: center, middle # How to have a data of penguins with bill length more than 43 mm? --- .panelset[ .panel[.panel-name[Codes] ```r penguins %>% filter(bill_length_mm > 43) ``` ] .panel[.panel-name[Output] ``` ## # A tibble: 188 Γ 8 ## species island bill_length_mm ## <fct> <fct> <dbl> ## 1 Adelie Torgersen 46 ## 2 Adelie Dream 44.1 ## 3 Adelie Torgersen 45.8 ## 4 Adelie Dream 43.2 ## 5 Adelie Biscoe 43.2 ## 6 Adelie Biscoe 45.6 ## 7 Adelie Torgersen 44.1 ## 8 Adelie Torgersen 43.1 ## 9 Gentoo Biscoe 46.1 ## 10 Gentoo Biscoe 50 ## # β¦ with 178 more rows, and 5 more ## # variables: bill_depth_mm <dbl>, ## # flipper_length_mm <int>, ## # body_mass_g <int>, sex <fct>, ## # year <int> ``` ] ] --- class: center, middle # How to have a data of Gentoo penguins with bill length more than 50 mm? --- .panelset[ .panel[.panel-name[Codes] ```r penguins %>% filter(species == "Gentoo", bill_length_mm > 55) ``` ] .panel[.panel-name[Output] ``` ## # A tibble: 3 Γ 8 ## species island bill_length_mm ## <fct> <fct> <dbl> ## 1 Gentoo Biscoe 59.6 ## 2 Gentoo Biscoe 55.9 ## 3 Gentoo Biscoe 55.1 ## # β¦ with 5 more variables: ## # bill_depth_mm <dbl>, ## # flipper_length_mm <int>, ## # body_mass_g <int>, sex <fct>, ## # year <int> ``` ] ] --- class: center, middle # How to have data of non-Gentoo penguins with bill length more than 45 mm and weight more than 4 kg? --- .panelset[ .panel[.panel-name[Codes] ```r penguins %>% filter(species != "Gentoo", bill_length_mm > 45, body_mass_g > 4000) ``` ] .panel[.panel-name[Output] ``` ## # A tibble: 18 Γ 8 ## species island bill_length_mm ## <fct> <fct> <dbl> ## 1 Adelie Torgersen 46 ## 2 Adelie Torgersen 45.8 ## 3 Adelie Biscoe 45.6 ## 4 Chinstrap Dream 46 ## 5 Chinstrap Dream 52 ## 6 Chinstrap Dream 50.5 ## 7 Chinstrap Dream 49.2 ## 8 Chinstrap Dream 52 ## 9 Chinstrap Dream 52.8 ## 10 Chinstrap Dream 54.2 ## 11 Chinstrap Dream 51 ## 12 Chinstrap Dream 52 ## 13 Chinstrap Dream 53.5 ## 14 Chinstrap Dream 50.8 ## 15 Chinstrap Dream 49 ## 16 Chinstrap Dream 50.7 ## 17 Chinstrap Dream 49.3 ## 18 Chinstrap Dream 50.8 ## # β¦ with 5 more variables: ## # bill_depth_mm <dbl>, ## # flipper_length_mm <int>, ## # body_mass_g <int>, sex <fct>, ## # year <int> ``` ] ] --- class: center, middle # How to have only top or bottom rows from data? --- .panelset[ .panel[.panel-name[Codes] ```r penguins %>% filter(species != "Gentoo", bill_length_mm > 45, body_mass_g > 4000) %>% * head() ``` ] .panel[.panel-name[Output] ``` ## # A tibble: 6 Γ 8 ## species island bill_length_mm ## <fct> <fct> <dbl> ## 1 Adelie Torgersen 46 ## 2 Adelie Torgersen 45.8 ## 3 Adelie Biscoe 45.6 ## 4 Chinstrap Dream 46 ## 5 Chinstrap Dream 52 ## 6 Chinstrap Dream 50.5 ## # β¦ with 5 more variables: ## # bill_depth_mm <dbl>, ## # flipper_length_mm <int>, ## # body_mass_g <int>, sex <fct>, ## # year <int> ``` ] ] --- .panelset[ .panel[.panel-name[Codes] ```r penguins %>% filter(species != "Gentoo", bill_length_mm > 45, body_mass_g > 4000) %>% * tail(3) ``` ] .panel[.panel-name[Output] ``` ## # A tibble: 3 Γ 8 ## species island bill_length_mm ## <fct> <fct> <dbl> ## 1 Chinstrap Dream 50.7 ## 2 Chinstrap Dream 49.3 ## 3 Chinstrap Dream 50.8 ## # β¦ with 5 more variables: ## # bill_depth_mm <dbl>, ## # flipper_length_mm <int>, ## # body_mass_g <int>, sex <fct>, ## # year <int> ``` ] ] --- class: your-turn, hide-logo # π§ YOUR TURN
10
:
00
.panelset[ .panel[.panel-name[Task] How many Chinstrap penguins are with bill length more than 45 mm and weight more than 4 kg? ] .panel[.panel-name[Codes] ```r penguins %>% filter(species == "Chinstrap", bill_length_mm > 45, body_mass_g > 4000) %>% head() ``` ] .panel[.panel-name[Output] ``` ## # A tibble: 6 Γ 8 ## species island bill_length_mm ## <fct> <fct> <dbl> ## 1 Chinstrap Dream 46 ## 2 Chinstrap Dream 52 ## 3 Chinstrap Dream 50.5 ## 4 Chinstrap Dream 49.2 ## 5 Chinstrap Dream 52 ## 6 Chinstrap Dream 52.8 ## # β¦ with 5 more variables: ## # bill_depth_mm <dbl>, ## # flipper_length_mm <int>, ## # body_mass_g <int>, sex <fct>, ## # year <int> ``` ] ] --- # `select()` function: Chooses rows based on column values. <img src="images/03-select.png" width="60%" style="display: block; margin: auto;" /> --- class: center, middle # How to have only `species` variable in data? --- .panelset[ .panel[.panel-name[Codes] ```r penguins %>% * select(species) ``` ] .panel[.panel-name[Output] ``` ## # A tibble: 344 Γ 1 ## species ## <fct> ## 1 Adelie ## 2 Adelie ## 3 Adelie ## 4 Adelie ## 5 Adelie ## 6 Adelie ## 7 Adelie ## 8 Adelie ## 9 Adelie ## 10 Adelie ## # β¦ with 334 more rows ``` ] ] --- class: center, middle # How to have a specific range of variables in data? --- .panelset[ .panel[.panel-name[Codes] ```r penguins %>% select(species : bill_depth_mm) ``` ] .panel[.panel-name[Output] ``` ## # A tibble: 344 Γ 4 ## species island bill_length_mm ## <fct> <fct> <dbl> ## 1 Adelie Torgersen 39.1 ## 2 Adelie Torgersen 39.5 ## 3 Adelie Torgersen 40.3 ## 4 Adelie Torgersen NA ## 5 Adelie Torgersen 36.7 ## 6 Adelie Torgersen 39.3 ## 7 Adelie Torgersen 38.9 ## 8 Adelie Torgersen 39.2 ## 9 Adelie Torgersen 34.1 ## 10 Adelie Torgersen 42 ## # β¦ with 334 more rows, and 1 more ## # variable: bill_depth_mm <dbl> ``` ] ] --- class: center, middle # How to have variables based upon their location in data? --- .panelset[ .panel[.panel-name[Codes] ```r penguins %>% select(4:8) ``` ] .panel[.panel-name[Output] ``` ## # A tibble: 344 Γ 5 ## bill_depth_mm flipper_length_mm ## <dbl> <int> ## 1 18.7 181 ## 2 17.4 186 ## 3 18 195 ## 4 NA NA ## 5 19.3 193 ## 6 20.6 190 ## 7 17.8 181 ## 8 19.6 195 ## 9 18.1 193 ## 10 20.2 190 ## # β¦ with 334 more rows, and 3 more ## # variables: body_mass_g <int>, ## # sex <fct>, year <int> ``` ] ] --- class: center, middle # How to have specific variables in data? --- .panelset[ .panel[.panel-name[Codes] ```r penguins %>% select(species, body_mass_g, year) ``` ] .panel[.panel-name[Output] ``` ## # A tibble: 344 Γ 3 ## species body_mass_g year ## <fct> <int> <int> ## 1 Adelie 3750 2007 ## 2 Adelie 3800 2007 ## 3 Adelie 3250 2007 ## 4 Adelie NA 2007 ## 5 Adelie 3450 2007 ## 6 Adelie 3650 2007 ## 7 Adelie 3625 2007 ## 8 Adelie 4675 2007 ## 9 Adelie 3475 2007 ## 10 Adelie 4250 2007 ## # β¦ with 334 more rows ``` ] ] --- .panelset[ .panel[.panel-name[Codes] ```r penguins %>% select(-c(species, body_mass_g, year)) ``` ] .panel[.panel-name[Output] ``` ## # A tibble: 344 Γ 5 ## island bill_length_mm bill_depth_mm ## <fct> <dbl> <dbl> ## 1 Torgersen 39.1 18.7 ## 2 Torgersen 39.5 17.4 ## 3 Torgersen 40.3 18 ## 4 Torgersen NA NA ## 5 Torgersen 36.7 19.3 ## 6 Torgersen 39.3 20.6 ## 7 Torgersen 38.9 17.8 ## 8 Torgersen 39.2 19.6 ## 9 Torgersen 34.1 18.1 ## 10 Torgersen 42 20.2 ## # β¦ with 334 more rows, and 2 more ## # variables: flipper_length_mm <int>, ## # sex <fct> ``` ] ] --- # `mutate()` function: Adds new variables that are functions of existing variables <img src="images/04-mutate.png" width="75%" style="display: block; margin: auto;" /> --- class: center, middle # How to convert penguin body mass from grams to kilograms? --- .panelset[ .panel[.panel-name[Codes] ```r penguins %>% * mutate(body_mass_kg = body_mass_g / 1000) ``` ] .panel[.panel-name[Output] ``` ## # A tibble: 344 Γ 9 ## species island bill_length_mm ## <fct> <fct> <dbl> ## 1 Adelie Torgersen 39.1 ## 2 Adelie Torgersen 39.5 ## 3 Adelie Torgersen 40.3 ## 4 Adelie Torgersen NA ## 5 Adelie Torgersen 36.7 ## 6 Adelie Torgersen 39.3 ## 7 Adelie Torgersen 38.9 ## 8 Adelie Torgersen 39.2 ## 9 Adelie Torgersen 34.1 ## 10 Adelie Torgersen 42 ## # β¦ with 334 more rows, and 6 more ## # variables: bill_depth_mm <dbl>, ## # flipper_length_mm <int>, ## # body_mass_g <int>, sex <fct>, ## # year <int>, body_mass_kg <dbl> ``` ] ] --- .panelset[ .panel[.panel-name[Codes] ```r penguins %>% select(body_mass_g) %>% mutate(body_mass_kg = body_mass_g / 1000) ``` ] .panel[.panel-name[Output] ``` ## # A tibble: 344 Γ 2 ## body_mass_g body_mass_kg ## <int> <dbl> ## 1 3750 3.75 ## 2 3800 3.8 ## 3 3250 3.25 ## 4 NA NA ## 5 3450 3.45 ## 6 3650 3.65 ## 7 3625 3.62 ## 8 4675 4.68 ## 9 3475 3.48 ## 10 4250 4.25 ## # β¦ with 334 more rows ``` ] ] --- .panelset[ .panel[.panel-name[Codes] ```r penguins %>% mutate(body_mass_kg = body_mass_g / 1000, bill = bill_length_mm * bill_depth_mm) ``` ] .panel[.panel-name[Output] ``` ## # A tibble: 344 Γ 10 ## species island bill_length_mm ## <fct> <fct> <dbl> ## 1 Adelie Torgersen 39.1 ## 2 Adelie Torgersen 39.5 ## 3 Adelie Torgersen 40.3 ## 4 Adelie Torgersen NA ## 5 Adelie Torgersen 36.7 ## 6 Adelie Torgersen 39.3 ## 7 Adelie Torgersen 38.9 ## 8 Adelie Torgersen 39.2 ## 9 Adelie Torgersen 34.1 ## 10 Adelie Torgersen 42 ## # β¦ with 334 more rows, and 7 more ## # variables: bill_depth_mm <dbl>, ## # flipper_length_mm <int>, ## # body_mass_g <int>, sex <fct>, ## # year <int>, body_mass_kg <dbl>, ## # bill <dbl> ``` ] ] --- .panelset[ .panel[.panel-name[Codes] ```r penguins %>% mutate(body_mass_kg = body_mass_g / 1000, bill = bill_length_mm * bill_depth_mm) %>% select(body_mass_kg, bill) ``` ] .panel[.panel-name[Output] ``` ## # A tibble: 344 Γ 2 ## body_mass_kg bill ## <dbl> <dbl> ## 1 3.75 731. ## 2 3.8 687. ## 3 3.25 725. ## 4 NA NA ## 5 3.45 708. ## 6 3.65 810. ## 7 3.62 692. ## 8 4.68 768. ## 9 3.48 617. ## 10 4.25 848. ## # β¦ with 334 more rows ``` ] ] --- # `arrange()` function: Changes the order of the rows. <img src="images/02-arrange.png" width="65%" style="display: block; margin: auto;" /> --- class: center, middle # How to have data arranged by the ascending order of bill length of penguins? --- .panelset[ .panel[.panel-name[Codes] ```r penguins %>% * arrange(bill_length_mm) ``` ] .panel[.panel-name[Output] ``` ## # A tibble: 344 Γ 8 ## species island bill_length_mm ## <fct> <fct> <dbl> ## 1 Adelie Dream 32.1 ## 2 Adelie Dream 33.1 ## 3 Adelie Torgersen 33.5 ## 4 Adelie Dream 34 ## 5 Adelie Torgersen 34.1 ## 6 Adelie Torgersen 34.4 ## 7 Adelie Biscoe 34.5 ## 8 Adelie Torgersen 34.6 ## 9 Adelie Torgersen 34.6 ## 10 Adelie Biscoe 35 ## # β¦ with 334 more rows, and 5 more ## # variables: bill_depth_mm <dbl>, ## # flipper_length_mm <int>, ## # body_mass_g <int>, sex <fct>, ## # year <int> ``` ] ] --- .panelset[ .panel[.panel-name[Codes] ```r penguins %>% * arrange(desc(bill_length_mm)) ``` ] .panel[.panel-name[Output] ``` ## # A tibble: 344 Γ 8 ## species island bill_length_mm ## <fct> <fct> <dbl> ## 1 Gentoo Biscoe 59.6 ## 2 Chinstrap Dream 58 ## 3 Gentoo Biscoe 55.9 ## 4 Chinstrap Dream 55.8 ## 5 Gentoo Biscoe 55.1 ## 6 Gentoo Biscoe 54.3 ## 7 Chinstrap Dream 54.2 ## 8 Chinstrap Dream 53.5 ## 9 Gentoo Biscoe 53.4 ## 10 Chinstrap Dream 52.8 ## # β¦ with 334 more rows, and 5 more ## # variables: bill_depth_mm <dbl>, ## # flipper_length_mm <int>, ## # body_mass_g <int>, sex <fct>, ## # year <int> ``` ] ] --- .panelset[ .panel[.panel-name[Codes] ```r penguins %>% arrange(species) ``` ] .panel[.panel-name[Output] ``` ## # A tibble: 344 Γ 8 ## species island bill_length_mm ## <fct> <fct> <dbl> ## 1 Adelie Torgersen 39.1 ## 2 Adelie Torgersen 39.5 ## 3 Adelie Torgersen 40.3 ## 4 Adelie Torgersen NA ## 5 Adelie Torgersen 36.7 ## 6 Adelie Torgersen 39.3 ## 7 Adelie Torgersen 38.9 ## 8 Adelie Torgersen 39.2 ## 9 Adelie Torgersen 34.1 ## 10 Adelie Torgersen 42 ## # β¦ with 334 more rows, and 5 more ## # variables: bill_depth_mm <dbl>, ## # flipper_length_mm <int>, ## # body_mass_g <int>, sex <fct>, ## # year <int> ``` ] ] --- class: center, middle, inverse # `summarise()` function --- # `summarise()` function: Chooses rows based on column values. <img src="images/05-summarise.png" width="75%" style="display: block; margin: auto;" /> --- class: center, middle # How to find mean bill length of all penguins? --- .panelset[ .panel[.panel-name[Codes] ```r penguins %>% * drop_na() %>% * summarise(mean_bill_length_mm = mean(bill_length_mm)) ``` ] .panel[.panel-name[Output] ``` ## # A tibble: 1 Γ 1 ## mean_bill_length_mm ## <dbl> ## 1 44.0 ``` ] ] --- class: center, middle # How to find species-wise mean bill length of penguins? --- .panelset[ .panel[.panel-name[Codes] ```r penguins %>% * drop_na() %>% * group_by(species) %>% summarise(mean_bill_length_mm = mean(bill_length_mm)) ``` ] .panel[.panel-name[Output] ``` ## # A tibble: 3 Γ 2 ## species mean_bill_length_mm ## <fct> <dbl> ## 1 Adelie 38.8 ## 2 Chinstrap 48.8 ## 3 Gentoo 47.6 ``` ] ] --- class: center, middle # How to find species-wise mean bill length of penguins and total number of penguins in each species? --- .panelset[ .panel[.panel-name[Codes] ```r penguins %>% drop_na() %>% group_by(species) %>% * summarise(mean_bill_length_mm = mean(bill_length_mm), n = n()) ``` ] .panel[.panel-name[Output] ``` ## # A tibble: 3 Γ 3 ## species mean_bill_length_mm n ## <fct> <dbl> <int> ## 1 Adelie 38.8 146 ## 2 Chinstrap 48.8 68 ## 3 Gentoo 47.6 119 ``` ] ] --- class: center middle hide-count # ππ½ββοΈπββοΈ<br>.big-text[Q&A] --- class: center, middle, inverse # Slide Crafting<br>using xaringan ### .orange[Next Module - 5] --- # Modules: 1. [Basics of R & RStudio](#module1) 1. [Dynamic Documents using R Markdown](#module2) 1. [Data Visualisation using ggplot2](#module3) 1. [Data Wrangling using dplyr](#module4) 1. .b[[Slide Crafting using xaringan](#module5)] --- name: module5 class: title-slide, left, middle, hide-count, hide-logo background-image: url("https://images.unsplash.com/photo-1638366271870-8b3d428f27f8?ixlib=rb-1.2.1&ixid=MnwxMjA3fDB8MHxwaG90by1wYWdlfHx8fGVufDB8fHx8&auto=format&fit=crop&w=1771&q=80") background-size: cover # .black.big-text[Slide<br>Crafting] ## .black[Session - 5] .footnote[ .white[Image credits:][Markus Spiske](https://images.unsplash.com/photo-1638366271870-8b3d428f27f8?ixlib=rb-1.2.1&ixid=MnwxMjA3fDB8MHxwaG90by1wYWdlfHx8fGVufDB8fHx8&auto=format&fit=crop&w=1742&q=80) ] --- class: hide-count, center <iframe width="960" height="615" src="https://www.youtube.com/embed/qmoZnf_3mIk" title="YouTube video player" frameborder="0" allow="accelerometer; autoplay; clipboard-write; encrypted-media; gyroscope; picture-in-picture" allowfullscreen></iframe> --- class: hide-count, middle, hide-logo background-image: url(images/xaringan-logo.png) background-size: contain background-position: right # .big-text[R<br>Package] --- # xaringan - xaringan package to be a Presentation Ninja π€Ί -- - "for creating slideshows with remark.js through R Markdown" -- - [Xie Yihui](https://yihui.org/en/) <img src="https://usesthis.com/images/interviews/yihui.xie/portrait.jpg" width="42%" style="display: block; margin: auto;" /> .footnote[ [Source](https://github.com/yihui/xaringan) ] --- # Packages required: ```r library(palmerpenguins) # to access penguin data library(xaringan) library(xaringanthemer) library(xaringanExtra) ``` --- class: center # File `\(\longrightarrow\)` New File `\(\longrightarrow\)` R Markdown <img src="images/rmd-new.png" width="75%" style="display: block; margin: auto;" /> --- class: center # Template `\(\rightarrow\)` Ninja Presentation <img src="images/xar1.png" width="55%" style="display: block; margin: auto;" /> --- class: center # Save this Rmd file <img src="images/xar2.png" width="50%" style="display: block; margin: auto;" /> --- class: center .pull-left[ ### Addins `\(\rightarrow\)` Inifinite Moon Reader <img src="images/xar3.png" width="65%" style="display: block; margin: auto;" /> ] -- .pull-right[ ### xaringan output <img src="images/xar4.png" width="566" style="display: block; margin: auto;" /> ] --- class: center .pull-left[ ### Addins `\(\rightarrow\)` Inifinite Moon Reader <img src="images/xar3.png" width="65%" style="display: block; margin: auto;" /> ] .pull-right[ ### xaringan slide `\(\rightarrow\)` browser <img src="images/xar5-browser.png" width="566" style="display: block; margin: auto;" /> ] -- - We need to click `Inifinite Moon Reader` only to start the slideshow. To see the changes made in the slides just save the document `ctrl + s` --- # Using xaringan how to: -- 1. create a new slide -- 1. hide an existing slide -- 1. heading, subheadings, points and normal text -- 1. include images -- - as background -- - as part of slide -- 1. make plots -- 1. include tables -- 1. in-text R output -- 1. create columns --- 1. Use `---` to create a new slide -- 1. `exclude:true` To hide an existing slide -- 1. Slide text sizes: -- - `#` for main heading -- - `##` for sub-heading -- - `####` for sub-sub-heading -- * indented `*` for sub-point1 * indented `*` for sub-point2 * indented `*` for sub-point3 -- - `-` for normal text size --- # To include images using: ### CSS `background` option: -- - `background-image: url("path of the image")` = path of the image -- - `background-size: contain, cover, 50%, 70%` = size of the image -- - `background-position: left top` = position of the image --- # To include images using: ### `knitr` chunk option: ```r knitr::include_graphics("path of the image") ``` --- # To include plots ```r library(palmerpenguins) ggplot(penguins, aes(x = species)) + geom_bar() ``` --- # To include tables ```r library(kableExtra) library(tidyverse) penguins %>% drop_na() %>% head() %>% kable() ``` <table> <thead> <tr> <th style="text-align:left;"> species </th> <th style="text-align:left;"> island </th> <th style="text-align:right;"> bill_length_mm </th> <th style="text-align:right;"> bill_depth_mm </th> <th style="text-align:right;"> flipper_length_mm </th> <th style="text-align:right;"> body_mass_g </th> <th style="text-align:left;"> sex </th> <th style="text-align:right;"> year </th> </tr> </thead> <tbody> <tr> <td style="text-align:left;"> Adelie </td> <td style="text-align:left;"> Torgersen </td> <td style="text-align:right;"> 39.1 </td> <td style="text-align:right;"> 18.7 </td> <td style="text-align:right;"> 181 </td> <td style="text-align:right;"> 3750 </td> <td style="text-align:left;"> male </td> <td style="text-align:right;"> 2007 </td> </tr> <tr> <td style="text-align:left;"> Adelie </td> <td style="text-align:left;"> Torgersen </td> <td style="text-align:right;"> 39.5 </td> <td style="text-align:right;"> 17.4 </td> <td style="text-align:right;"> 186 </td> <td style="text-align:right;"> 3800 </td> <td style="text-align:left;"> female </td> <td style="text-align:right;"> 2007 </td> </tr> <tr> <td style="text-align:left;"> Adelie </td> <td style="text-align:left;"> Torgersen </td> <td style="text-align:right;"> 40.3 </td> <td style="text-align:right;"> 18.0 </td> <td style="text-align:right;"> 195 </td> <td style="text-align:right;"> 3250 </td> <td style="text-align:left;"> female </td> <td style="text-align:right;"> 2007 </td> </tr> <tr> <td style="text-align:left;"> Adelie </td> <td style="text-align:left;"> Torgersen </td> <td style="text-align:right;"> 36.7 </td> <td style="text-align:right;"> 19.3 </td> <td style="text-align:right;"> 193 </td> <td style="text-align:right;"> 3450 </td> <td style="text-align:left;"> female </td> <td style="text-align:right;"> 2007 </td> </tr> <tr> <td style="text-align:left;"> Adelie </td> <td style="text-align:left;"> Torgersen </td> <td style="text-align:right;"> 39.3 </td> <td style="text-align:right;"> 20.6 </td> <td style="text-align:right;"> 190 </td> <td style="text-align:right;"> 3650 </td> <td style="text-align:left;"> male </td> <td style="text-align:right;"> 2007 </td> </tr> <tr> <td style="text-align:left;"> Adelie </td> <td style="text-align:left;"> Torgersen </td> <td style="text-align:right;"> 38.9 </td> <td style="text-align:right;"> 17.8 </td> <td style="text-align:right;"> 181 </td> <td style="text-align:right;"> 3625 </td> <td style="text-align:left;"> female </td> <td style="text-align:right;"> 2007 </td> </tr> </tbody> </table> --- # In-text R output - penguins data have a sample of `\(n\)` = 344 on total 8 variables. -- - math expressions `\(a + b = \sigma - \sum{x}_2^2\)` --- # Column division of slide .pull-left[ ##- left column - a - b - c ] .pull-right[ ##- right column - apple - boy - cat ] --- # Slide `class` - class can be assigned to each slide -- - it decides how all elements of one particular slide will look like --- class: center # Slide `class` - class can be assigned to each slide - it decides how all elements of one particular slide will look like - `class: center` --- class: center, middle, inverse, right # Slide `class` - class can be assigned to each slide - it decides how all elements of one particular slide will look like - `class: center, middle, inverse, right` --- # Extend the power of xaringan: -- - using R packages like [xaringanExtra](https://pkg.garrickadenbuie.com/xaringanExtra/#/README?id=xaringanextra) -- - learn little about [CSS](https://www.w3schools.com/css/) -- - use [cheatsheets](https://rstudio.com/resources/cheatsheets/) --- class: hide-logo, hide-count, middle background-image: url("images/giphy.gif") background-position: 10% background-color: #353935 background-size: 35% .pull-right[ # .center.white[Congratulations!!! <br><br>π π₯³ π<br><br>Thank you] ]